MR8740T_user_manual_eng_20191016H.pdf - 第141页
136 Conguring the Numerical Calculation Settings 7.2 Conguring the Numerical Calculation Settings > [Calculation] > [Numerical calculation] 7 1 3 4 2 5 6 1 Click the [Numerical calculation] button to set it to [O…
135
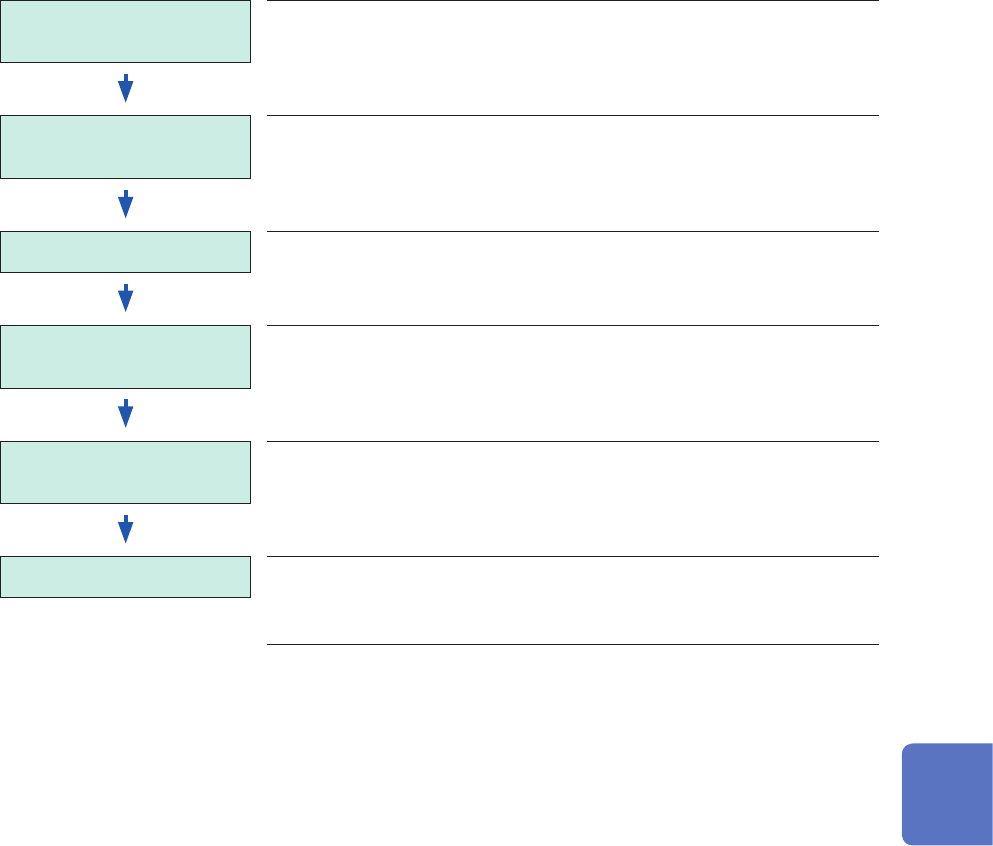
Numerical Calculation Procedure
Making calculations using existing data
(Loading data) (To load measured data from a storage device to use for
calculation)
(p. 94)
Conguring the calculation
settings
Congure the calculation settings on the [Numerical
calculation] screen.
Set evaluation criteria to evaluate calculation results.
(p. 136)
(p. 148)
Performing calculation Choose [Execute] to execute calculations.
(To force-quit the calculation, click the stop icon.)
Displaying calculation
results
The waveform screen displays numerical calculation
results.
(p. 147)
(Evaluating calculation
results)
(Only when the evaluation setting is enabled)
(Saving results) Save calculation results as needed.
• To save the calculation results, click the save icon.
To specify a range for calculation
Before executing the calculation, specify a calculation range with the trace cursors on the waveform
screen. Set [Area] to [A_B] or [C_D] on the [Numeric calculation] screen.
Refer to “7.2 Conguring the Numerical Calculation Settings” (p. 136).
7
Numerical Calculation Function
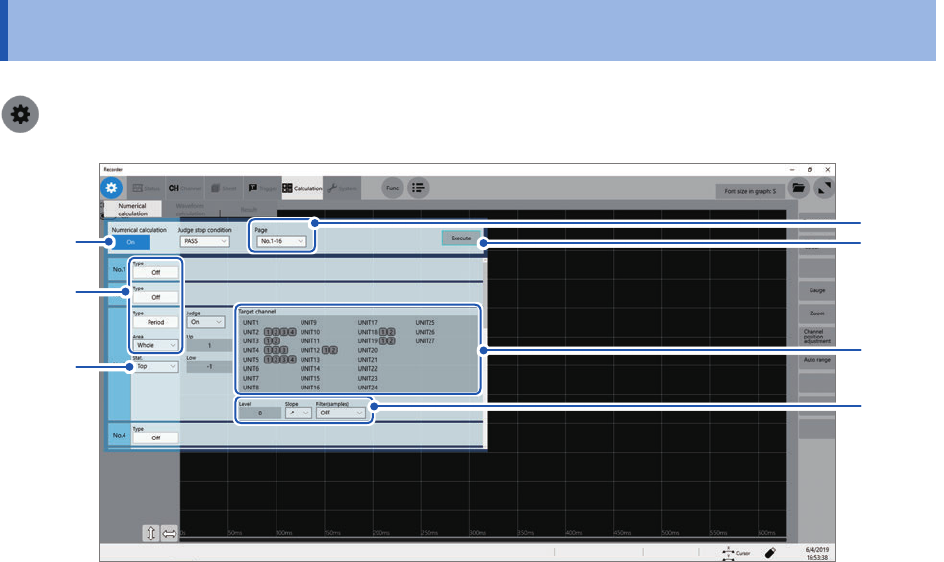
136
Conguring the Numerical Calculation Settings
7.2 Conguring the Numerical Calculation Settings
> [Calculation] > [Numerical calculation]
7
1
3
4
2
5
6
1
Click the [Numerical calculation] button to set it to [On].
2
Click the [Page] box, and then choose calculation numbers.
You can specify up to 108 numerical calculations.

137
Conguring the Numerical Calculation Settings
3
Click the [Calculation Type] box, and then choose a calculation type from the list.
Off
The instrument does not perform any calculation.
Average value Average value of waveform data
RMS RMS value of waveform data
P-P Peak-to-peak value of waveform data
Maximum Maximum value of waveform data
Time to maximum Period of time elapsed from a trigger point to the time of the maximum value
Minimum Minimum value of waveform data
Time to minimum Period of time elapsed from a trigger point to the time of the minimum value
Period*
2
Period of waveform data
Frequency*
2
Frequency of waveform data
Rise time*
1
Rise time of waveform data
Fall time*
1
Fall time of waveform data
Standard deviation Standard deviation of waveform data
Area Area enclosed by the horizontal axis and waveform data
X-Y area Area enclosed by an X-Y composite curve
Time to level*
2
Period of time elapsed from a trigger point to the time when waveform data
reached the specied level
Level at time*
2
Measured value when the specied time has elapsed from a trigger point
Pulse width*
2
Pulse width of waveform data
Duty ratio*
2
Duty ratio of waveform data
Pulse count*
2
Pulse count of waveform data
Arithmetic operations Four arithmetic operations of numerical calculation results
Time difference*
2
Time lag between phenomena A and B
Phase contrast*
2
Time lag between phenomena A and B represented as a phase difference
High level*
1
High level of waveform data
Low level*
1
Low level of waveform data
Intermediate value Intermediate value of waveform data
Amplitude*
1
Amplitude value of waveform data
Overshoot
*
1
Overshoot value of waveform data
Undershoot
*
1
Undershoot value of waveform data
+Width*
1
Time value above the intermediate level
−Width*
1
Time value below the intermediate level
Burst width*
2
Burst width of waveform data
Accumulation Accumulated value of waveform data
Angle of XY waveform Slope angle of a regression line on an X-Y composite curve
*1: Unable to make any calculations using data acquired across the measurement channels of Model MR8990
and Model MR8990 Digital Voltmeter Unit.
*2: The settings can also be congured for the logic channels.
Refer to “Calculation target channels and setting contents of calculation conditions for each calculation type”
(p. 139).
7
Numerical Calculation Function