MR8740T_user_manual_eng_20191016H.pdf - 第24页
19 2 Operating the W aveform Screen and Analyzing Data Y ou can analyze measured data with various functions including cursor measurement of input waveforms and searches on the waveform screen. Y ou can also change measu…

18
Starting/Stopping Measurement
1.5 Starting/Stopping Measurement
Starting a measurement
When you click the start icon, the instrument starts a measurement.
• Waveform data shown on the screen is cleared once the measurement starts.
• You can also start a measurement by inputting a signal into the external control terminal.
Refer to “12 Externally Controlling the Instrument” (p. 209).
Waveform display during measurement
In general, the waveforms appear after data with the specied recording length has been acquired.
When the measurement speed is relatively slow, the instrument displays waveforms while it is
acquiring the data.
However, even if a slow-speed range is set, the instrument may display waveforms after it has been
acquired the data of the whole waveform, depending on the overlaying or magnication setting.
To automatically save data during measurement
Refer to “Automatically saving waveform data” (p. 84).
Stopping the measurement
Clicking the stop icon once stops the measurement after the instrument has acquired the
waveforms with the specied recording length.
Click the stop icon once and click [OK] on the dialog box displayed to stop the measurement.
19
2
Operating the Waveform Screen
and Analyzing Data
You can analyze measured data with various functions including cursor measurement of input
waveforms and searches on the waveform screen. You can also change measurement conditions
or other settings on this screen.
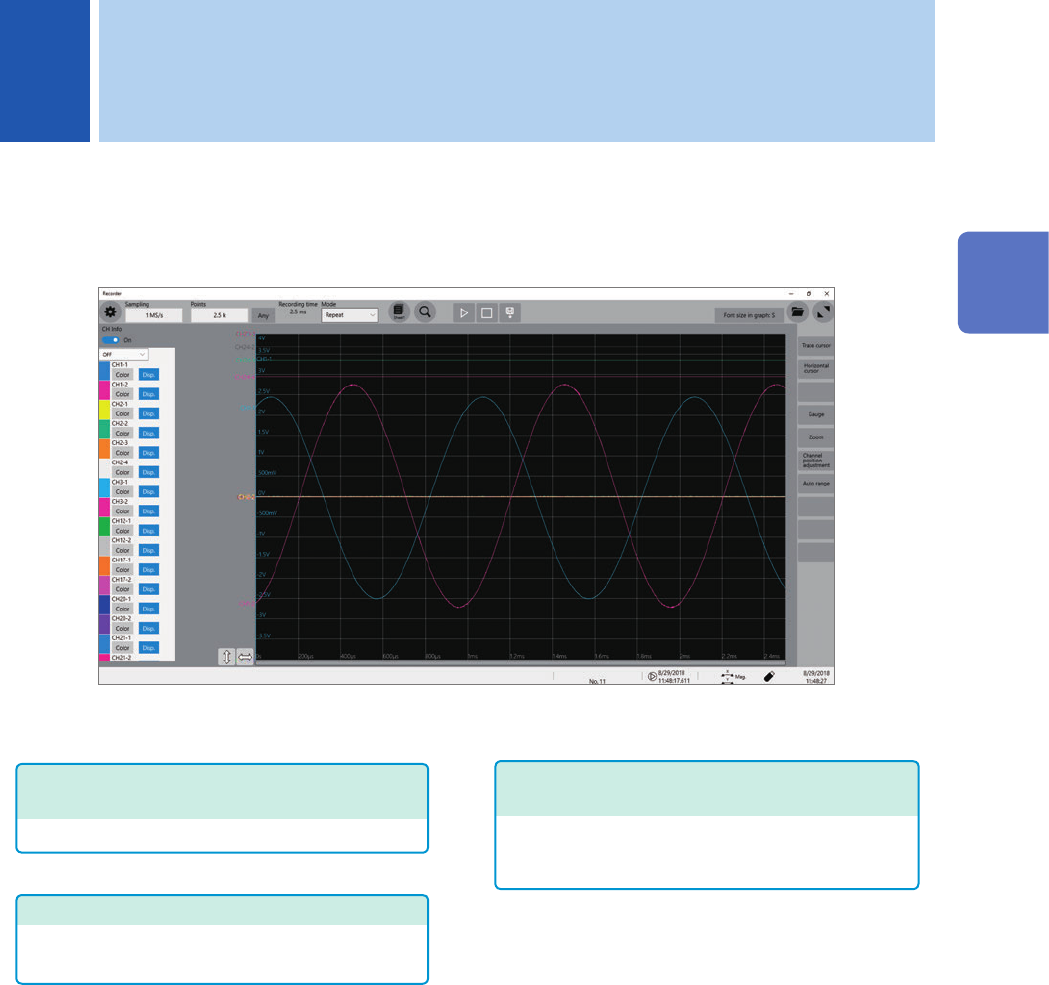
Operation available on the waveform screen
Changing the display magnication of
waveforms
• Magnifying/demagnifying waveforms (p. 29)
• Magnifying a part of waveforms horizontally
(p. 33)
Using the trace cursors and horizontal
cursors
• Reading measured values (p. 20)
Moving the waveform display position
• Moving waveforms by dragging them
• Moving waveforms with the scroll bar
You can display or hide waveforms with [CH Info] set to [On].
You can also change waveform color.
• Clicking [Color] allows you to change the waveform display color.
• Clicking [Disp.] toggles between showing and hiding a waveform.
• Right-clicking [Disp.] toggles between showing and hiding waveforms acquired across all
channels.
Setting [CH Info] to [Level Monitor] allows display values of signals being inputted into measuring
modules.
2 Operating the Waveform Screen and Analyzing Data
2
Operating the Waveform Screen and Analyzing Data
20
Reading Measured Values (Trace Cursors, Horizontal cursor)
2.1 Reading Measured Values (Trace Cursors,
Horizontal cursor)
You can read measured values (scaled values when the scaling is used) using cursors on the
waveform screen.
The instrument can simultaneously display up to eight cursors, which contains the trace cursors
and horizontal cursors.
You can read differences in measured values and time values between any two cursors you choose
from among all cursors.
The display way of the cursor values varies depending on the chosen cursor type.
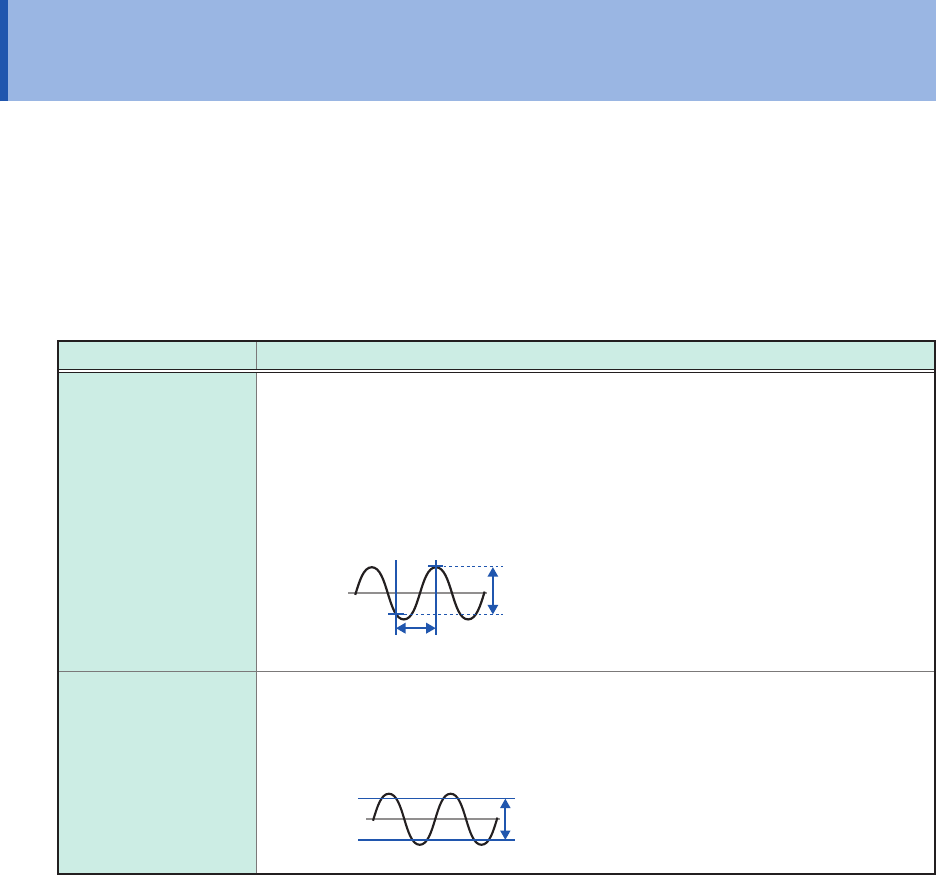
Cursor type Cursor value
Trace cursor
When you select trace cursor A and trace cursor B
Time: Time between the trigger point or recording starting point and the trace
cursor
Measured value: The measured value at the point where a waveform crosses a
trace cursor
B-A: Difference in measured values between trace cursor B and trace cursor A
B − A (Time lag)
B − A (Difference between measured values)
A B
Horizontal cursor
When you choose horizontal cursor A and horizontal cursor B
Measured value: The vertical axis value at a horizontal cursor
B − A: Difference in measured value along with vertical value between horizontal
cursor A and horizontal cursor B
A
B
B − A (Difference between measured values)
When the external sampling is used, the time is represented in the number of samples.