MR8740T_user_manual_eng_20191016H.pdf - 第158页
153 Numerical Calculation T ypes and Descriptions Calculation type Description Area Method : Negative (Only the negative- amplitude part) Calculates an area enclosed by the zero-level (zero-potential) line and the negati…
152
Numerical Calculation Types and Descriptions
Calculation
type
Description
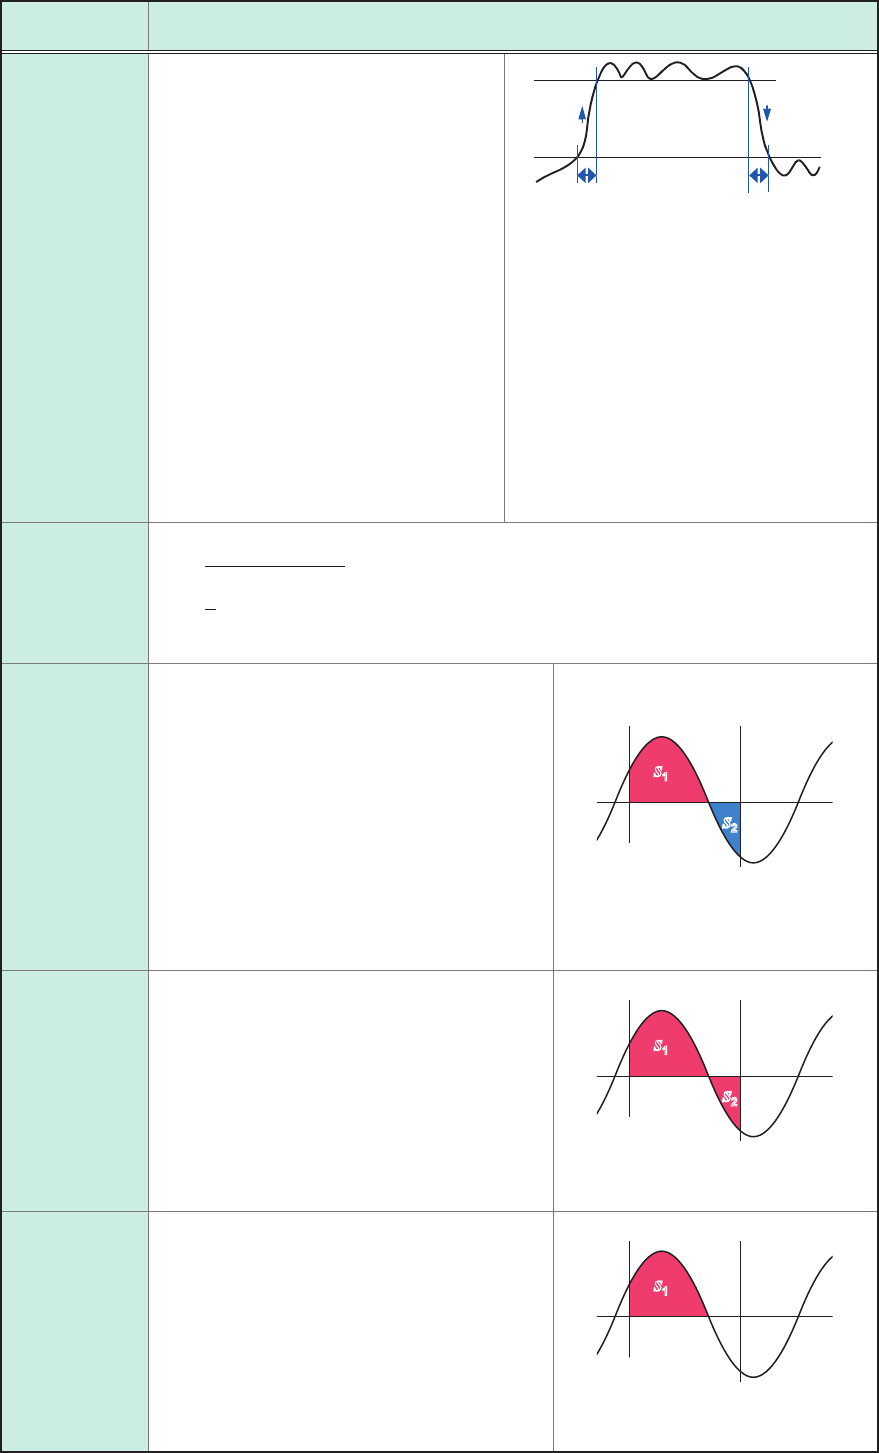
Rise time
Fall time
Calculates a A%-to-B% rise time (or a B%-
to-A% fall time; unit: s) based on the 0%
and 100% levels based on a histogram
(frequency distribution) of acquired
waveform data.
The instrument calculates a rise time (or
fall time) of the rst rising (or falling) slope
that appears in acquired waveform data.
When the range is specied, the
instrument calculates the rise time (or fall
time) of the rst rising (or falling) slope that
appears between the cursors.
The values of A and B can be specied
(unit: percent). The values of A and B
varies along with each other. When the
value of A is 5%, the value of B is specied
at 95%; when the value of A is 30%, the
value of B is specied at 70%.
Settings: Rise time (A% to B%) and Fall
time (B% to A%) values (%),
Stat.
B%
A%
Rise time Fall time
A: 5% to 30%
B: 95% to 70%
Standard
deviation
Calculates a standard deviation of waveform data.
σ
: Standard deviation
AV E
: Average value
n
: Number of data points
di
:
i
th data point acquired across the channel
Area
Method: Total
Calculates an area by subtracting an area (unit:
V·s) enclosed by the zero-level (zero-potential)
line and the negative-amplitude part of a signal
waveform from an area (unit: V·s) enclosed
by the zero-level (zero-potential) line and the
positive-amplitude part of the signal waveform.
When the range is specied, calculates the area
between the cursors.
S
: Area
n
: Number of data points
di
:
i
th data point acquired
across the channel
h
=
Δt
: Sampling interval
di • h
S =
∑
i = 1
n
s
1
sss
2
s
1
ss
2
Cursor A
Cursor B
S
=
s
1
−
s
2
Area
Method:
Absolute value
Calculates an area value (unit: V·s) enclosed by
the zero-level (zero-potential) line and a signal
waveform.
When the range is specied, calculates the area
between the cursors.
S
: Area
n
: Number of data points
di
:
i
th data point acquired
across the channel
h
=
Δt
: Sampling interval
|di| • h
S =
∑
i = 1
n
s
1
sss
2
s
1
ss
2
Cursor A
Cursor B
S
=
s
1
+
s
2
Area
Method:
Positive
(Only the
positive-
amplitude part)
Calculates an area enclosed by the zero-level
(zero-potential) line and the positive-amplitude
part of a signal waveform.
When the range is specied, calculates the area
between the cursors.
S
: Area
n
: Number of data points
di
:
i
th data point acquired
across the channel
h
=
Δt
: Sampling interval
di • h
S =
∑
i = 1, di > 0
n
s
1
s
1
Cursor A
Cursor B
S
=
s
1
153
Numerical Calculation Types and Descriptions
Calculation
type
Description
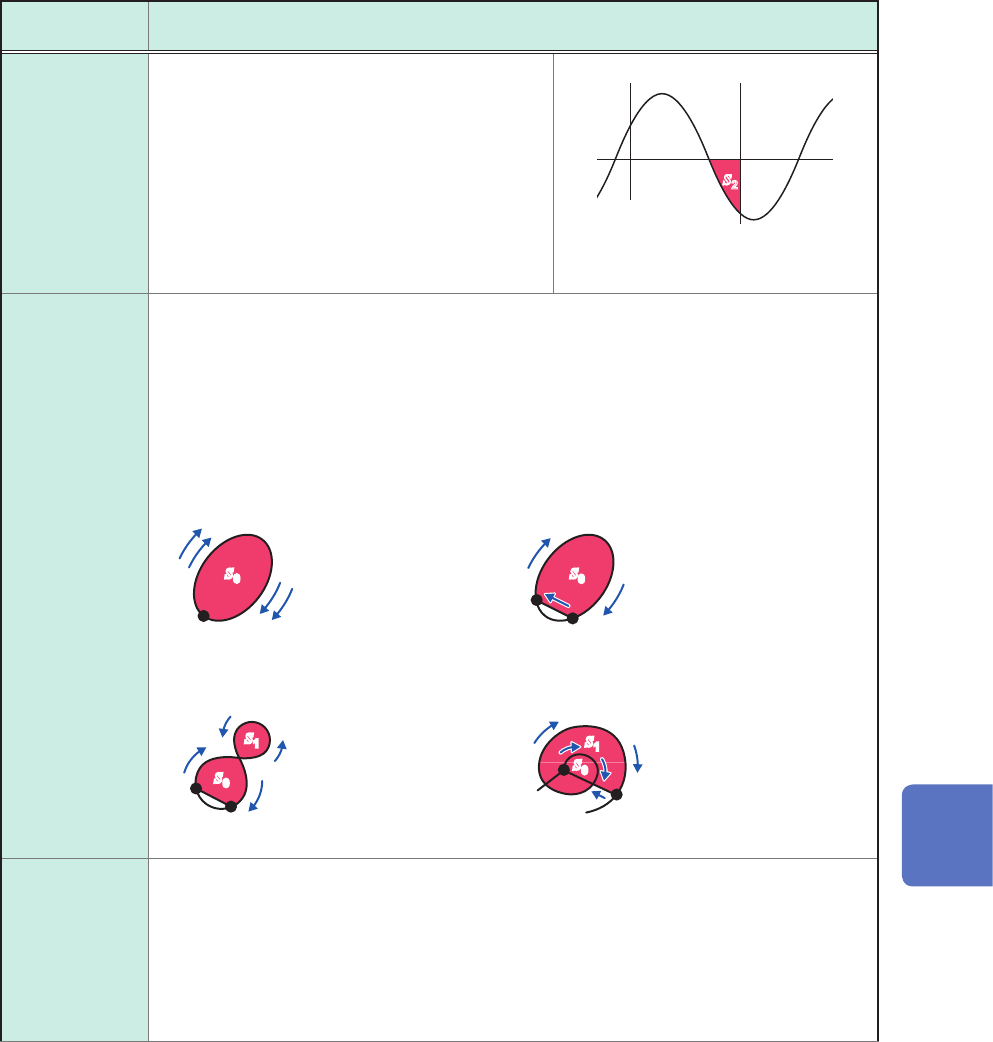
Area
Method:
Negative
(Only the
negative-
amplitude part)
Calculates an area enclosed by the zero-level
(zero-potential) line and the negative-amplitude
part of a signal waveform.
When the range is specied, calculates the area
between the cursors.
S
: Area
n
: Number of data points
di
:
i
th data point acquired
across the channel
h
=
Δt
: Sampling interval
di • h
S =
∑
i = 1, di < 0
n
sss
2
ss
2
Cursor A
Cursor B
S
= −
s
2
X-Y area
Method:
Coordinate
method
Calculates the area (unit: V
2
) of the gure enclosed by the X-Y composite curve. The
instrument calculates an area enclosed by the lines as illustrated below. An area can be
calculated even when no X-Y composite curve is displayed.
You can specify a calculation range on the horizontal axis (time-axis) waveform of each
channel with the cursors. The area of the X-Y composite curve is calculated within the
specied range (you cannot directly specify the range on the X-Y waveform with the
cursors).
Refer to “2.1 Reading Measured Values (Trace Cursors, Horizontal cursor)” (p. 20).
s
0
s
0
s
0
s
1
s
1
s
0
When multiple loops plot When an open curve plots
When a gure of eight plots When a spiral loop plots
S
=
n
×
s
0
S
: Area
n
: Number of loops
S
=
s
0
S
: Area
(Closed area is created
by connecting the start
and end points with a
straight line.)
Start point, end point
Start
point
End point
Start
point
End
point
Start
point
End point
S
= |
s
0
−
s
1
|
S
: Area
S
=
s
0
× 2 +
s
1
S
: Area
(The number of
overlapping segments
increases with a loop
count.)
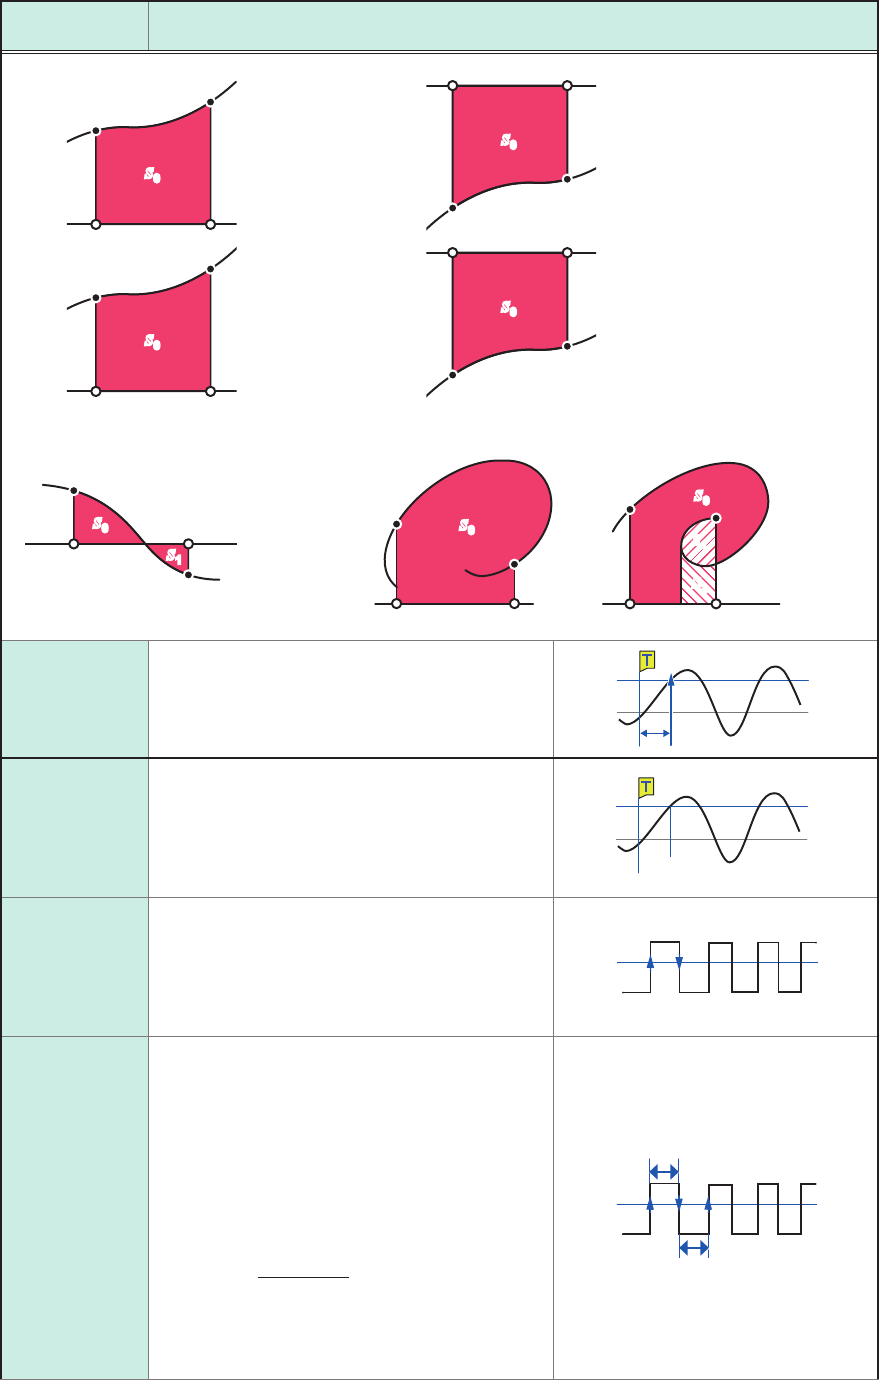
X-Y area
Method:
Trapezoidal
approximation
Calculates an area (unit: V
2
) enclosed by an X-Y composite curve using the trapezoidal
approximation method. The instrument calculates an area enclosed by the lines as
illustrated below. An area can be calculated even when no X-Y composite curve is
displayed.
You can specify a calculation range on the horizontal axis (time-axis) waveform of each
channel with the cursors. The area of the X-Y composite curve is calculated within the
specied range (you cannot directly specify the range on the X-Y waveform with the
cursors).
7
Numerical Calculation Function
154
Numerical Calculation Types and Descriptions
Calculation
type
Description
When a Y data point corresponds to an X data point
s
0
Start point
End point
X-axis (Y = 0)
Area
S
=
s
0
s
0
End point
Start point
X-axis (Y = 0)
Area
S
= −
s
0
s
0
Start point
End point
X-axis (Y = 0)
Area
S
= −
s
0
s
0
End point
Start point
X-axis (Y = 0)
Area
S
=
s
0
s
0
s
1
When a waveform includes negative
amplitude
Start point
End point
When multiple Y data points
correspond to an XY data point
X-axis (Y = 0)
Area
S
=
s
0
−
s
1
s
0
s
0
s
1
s
2
X-axis (Y = 0)
Area
S
=
s
0
X-axis (Y = 0)
Area
S
=
s
0
+
2
×
s
1
+
s
2
Time to level
Searches a calculation range from the beginning
for the time when a signal crossed the specied
level and calculates a period of time from a
trigger point to a point searched for.
Settings: Level, Slope, Filter
0
V
Level
Level at time
Calculates a level when the specied time has
elapsed from a trigger point.
You can also specify a time based on previously
calculated results.
Settings: Method (Time, Calc. No.), Time/
calculation number (No. 1 to No.107)
0 V
Level
T (Time)
Pulse width
Calculates a pulse width based on a time lag
between the time when a waveform crossed
the specied level in the positive (or negative)
direction and the time when it next crossed the
specied level in the opposite direction.
Settings: Level, Slope, Filter, Stat.
Level
Duty ratio
Calculates a duty ratio based on a time lag
between the time when a waveform crossed the
specied level in the positive direction and the
time when it next crossed the specied level in
the opposite direction, and a time lag between
the time when the waveform crossed the
specied level in the negative direction and the
time when it next crossed the specied level in
the opposite direction.
=
× 100 [%]
T
u-d
T
u-d
T
d-u
+
Duty ratio
T
u-d
: Time from rising edge to falling edge (unit: s)
T
d-u
: Time from falling edge to rising edge (unit: s)
Settings: Level, Filter, Stat.
Level
T
u-d
T
d-u