MR8740T_user_manual_eng_20191016H.pdf - 第22页
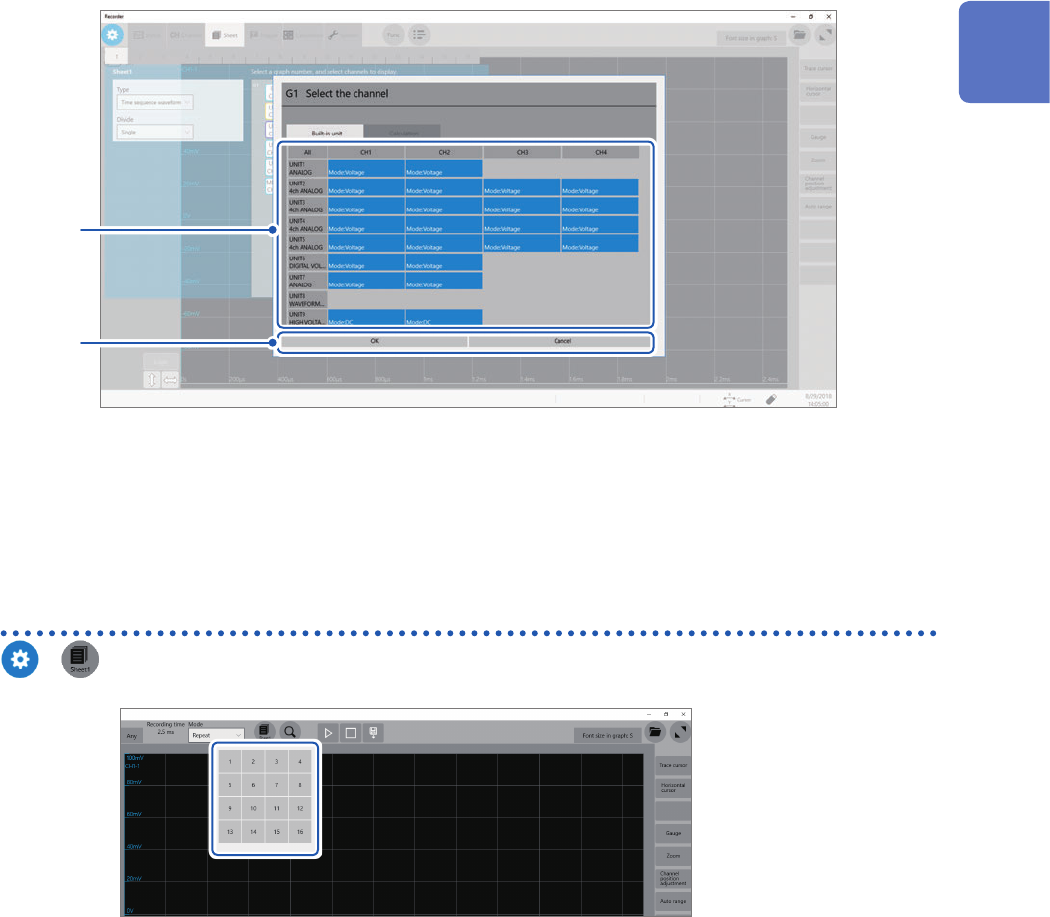
17 Conguring the Sheet Settings 5 Choose channels to be displayed on the graph. All channels are chosen in the default setting. Click a button to deselect a channel (Click it again to select it). 5 6 6 Click [OK] . Y ou…
16
Conguring the Sheet Settings
1.4 Conguring the Sheet Settings
You can dene the display format of waveforms on the sheet. You can dene different display
formats for each of the 16 sheets You can also switch sheets to be displayed on the waveform
screen.
> [Sheet]
1
4
2
3
1
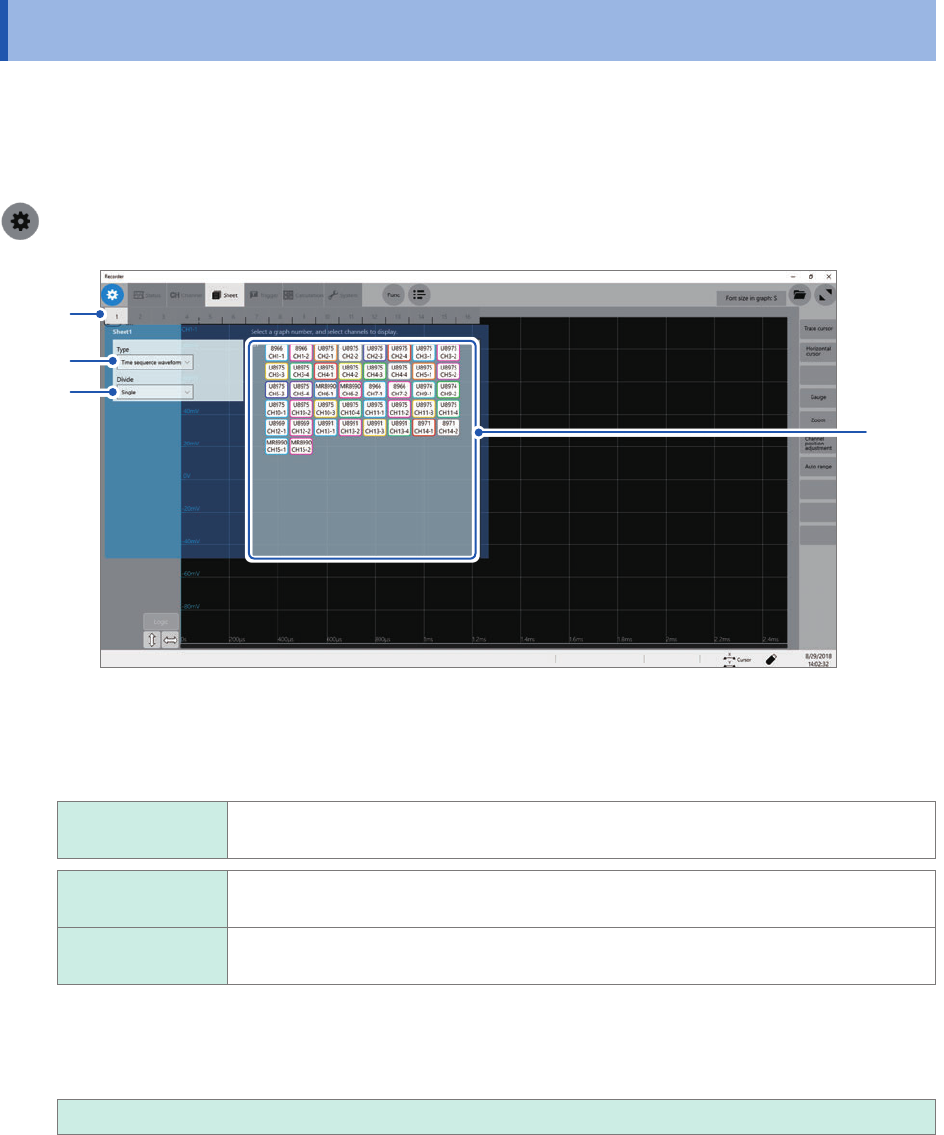
Choose a sheet.
2
Click the [Type] box, and then choose a display format from the list.
Time series
waveform
Displays time-domain waveforms.
Time series
waveform
Displays time-domain waveforms.
XY composite
waveform
Displays XY composite waveforms.
3
Click the [Divide] box, and then choose an option for the number of screens to be divided
from the list.
You can split the screen into multiple screens (graphs).
Single
, Dual, Quad, Octa, Hexadeca
4
Assign channels to the graph.
Click the display panel of each graph to open the [Select the channel] dialog box.
17
Conguring the Sheet Settings
5
Choose channels to be displayed on the graph.
All channels are chosen in the default setting. Click a button to deselect a channel (Click it again to select it).
5
6
6
Click [OK].
Your selection is conrmed.
Clicking [Cancel] closes the dialog box without your selection conrmed.
Switching sheets on the waveform screen
>
Choose sheet numbers to be displayed.
1
Measurement Method

18
Starting/Stopping Measurement
1.5 Starting/Stopping Measurement
Starting a measurement
When you click the start icon, the instrument starts a measurement.
• Waveform data shown on the screen is cleared once the measurement starts.
• You can also start a measurement by inputting a signal into the external control terminal.
Refer to “12 Externally Controlling the Instrument” (p. 209).
Waveform display during measurement
In general, the waveforms appear after data with the specied recording length has been acquired.
When the measurement speed is relatively slow, the instrument displays waveforms while it is
acquiring the data.
However, even if a slow-speed range is set, the instrument may display waveforms after it has been
acquired the data of the whole waveform, depending on the overlaying or magnication setting.
To automatically save data during measurement
Refer to “Automatically saving waveform data” (p. 84).
Stopping the measurement
Clicking the stop icon once stops the measurement after the instrument has acquired the
waveforms with the specied recording length.
Click the stop icon once and click [OK] on the dialog box displayed to stop the measurement.