MR8740T_user_manual_eng_20191016H.pdf - 第31页
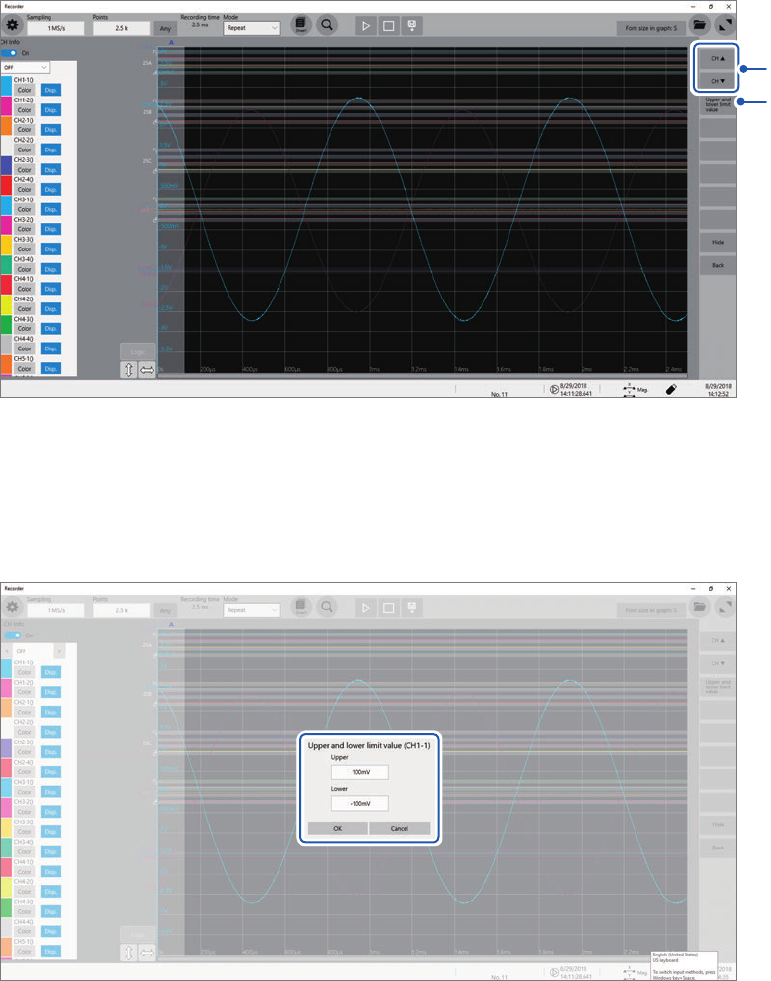
26 Displaying V ertical Scales (Gauge Function) 3 Click [CH ] or [CH ] to choose a channel to be displayed. 3 4 Clicking [Hide] hides the gauges. 4 Click [Upper and lower limit value] . The setting dialog box appears…
25
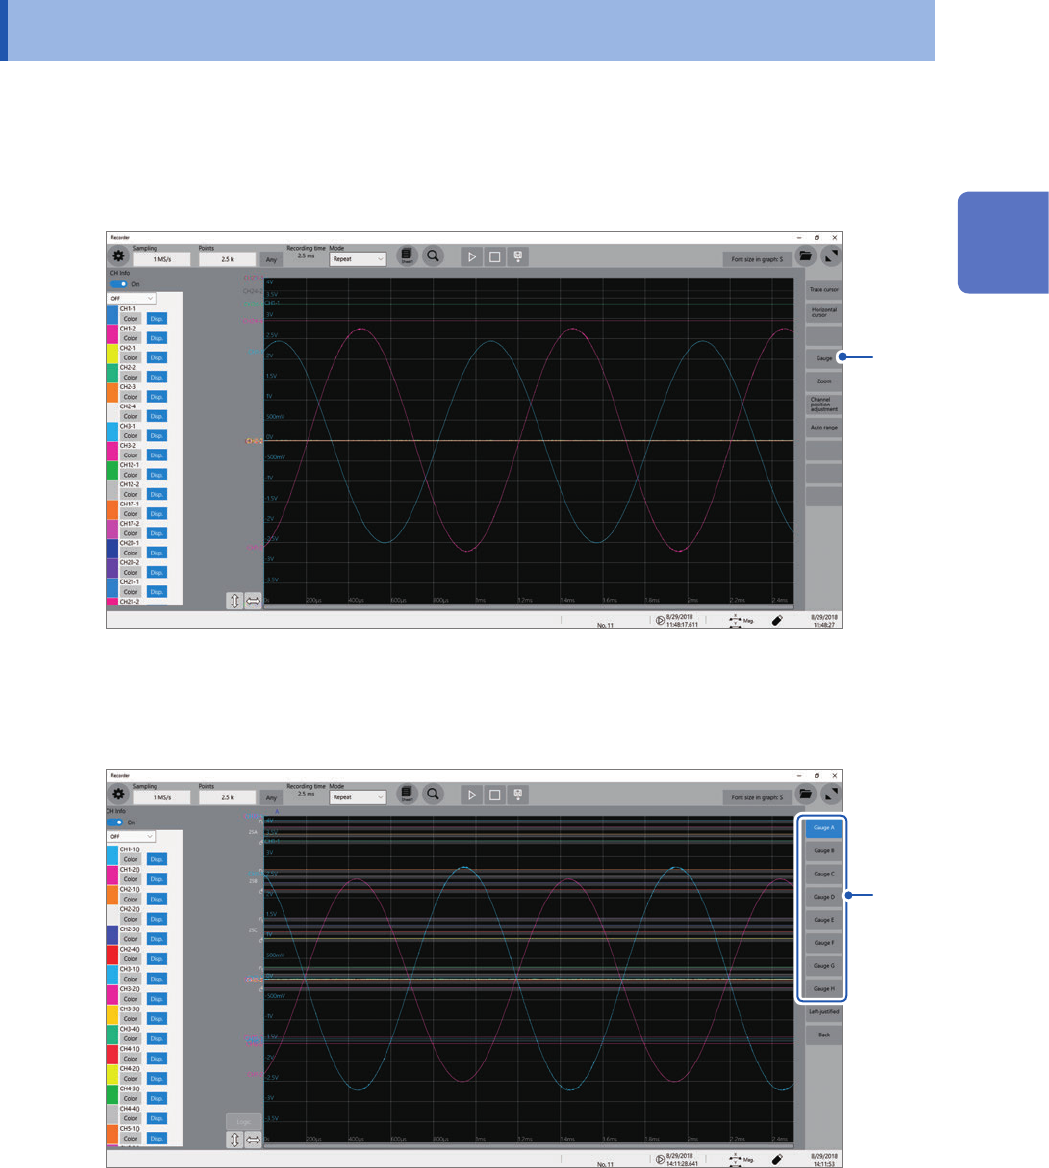
Displaying Vertical Scales (Gauge Function)
2.2 Displaying Vertical Scales (Gauge Function)
Using the gauge function enables the vertical scales (for convenience, hereafter referred to as
“gauges”) to be displayed overlapping waveforms.
1
Click [Gauge].
1
2
Choose gauges to be displayed from among [Gauge A] through [Gauge H].
The screen display the gauges at the left.
You can move a gauge after click it to select.
2
Click [Left-justied] aligns the gauges to the left.
2
Operating the Waveform Screen and Analyzing Data
26
Displaying Vertical Scales (Gauge Function)
3
Click [CH ] or [CH ] to choose a channel to be displayed.
3
4
Clicking [Hide] hides the gauges.
4
Click [Upper and lower limit value].
The setting dialog box appears. You can specify the display range of each channel.
Enter an upper and lower values in the [Upper] and [Lower] boxes, respectively, and then click [OK].
27
Scrolling Through Waveforms
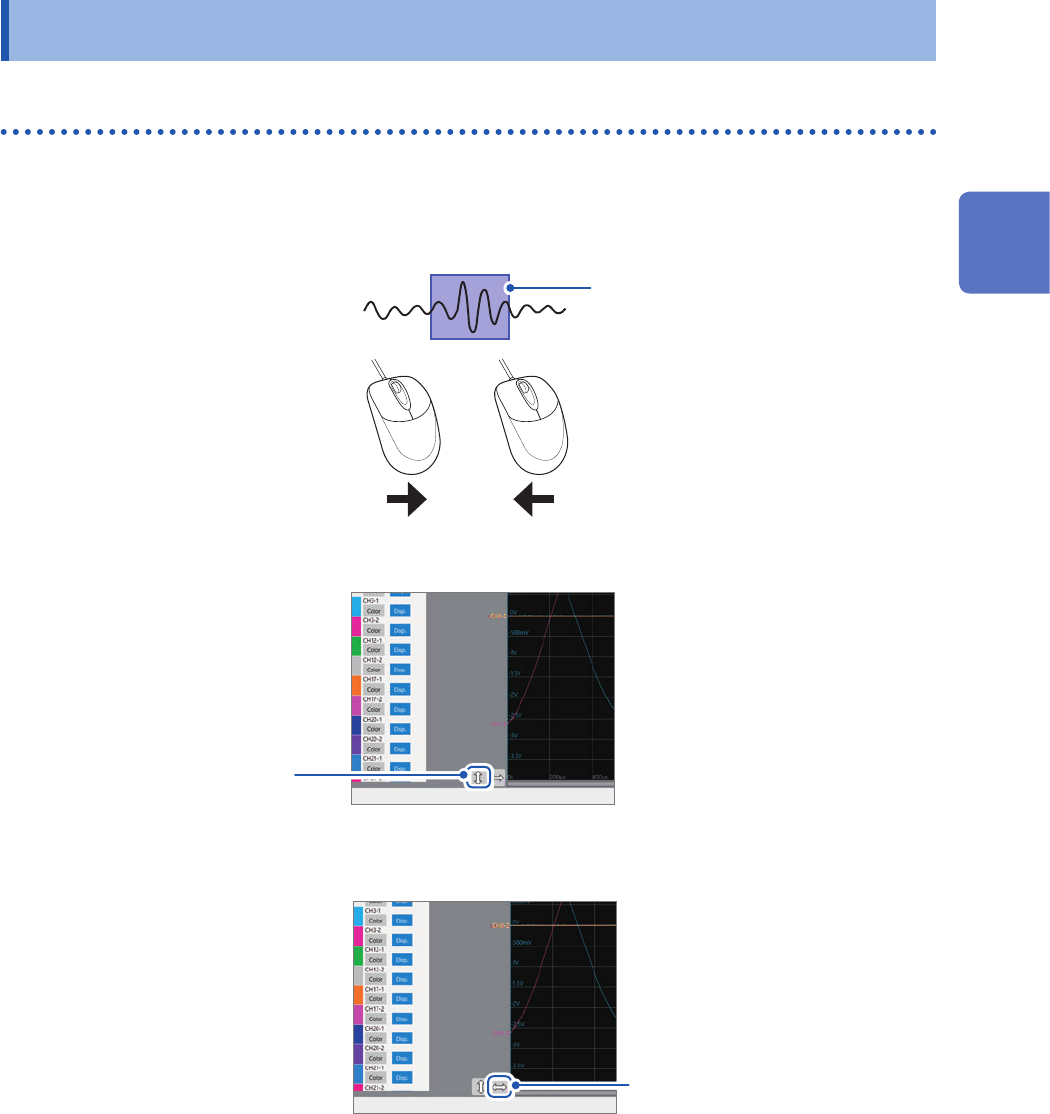
2.3 Scrolling Through Waveforms
Scrolling through waveforms
Dragging the waveform screen scrolls through waveforms that are being measured or existing
waveforms.
Scrolling direction
Screen display
Previous Latest
Dragging the waveform
rightward:
Scrolls through the waveform
backward from the present.
Dragging the waveform leftward:
Scrolls through the waveform
forward from the present.
To anchor the waveforms vertically
Click the vertical arrows
button to anchor waveforms
in the vertical direction.
To anchor the waveforms horizontally
Click the horizontal
arrows button to anchor
waveforms in the
horizontal direction.
To observe waveforms previously obtained during slow-speed measurement
When the waveforms are being displayed during a slow-speed measurement, dragging the
waveform screen allows you to observe waveforms previously obtained. To observe the waveforms
that are presently measured again, click [
] on the screen.
2
Operating the Waveform Screen and Analyzing Data