3OM-996-005.pdf - 第239页
3. 2 "Machine Performance Data" T ab The corresponding tab sheet enables the operator to view the informa- tion on machine performance. • Sheet Layout When the "Machine Performance Data" tab is presse…
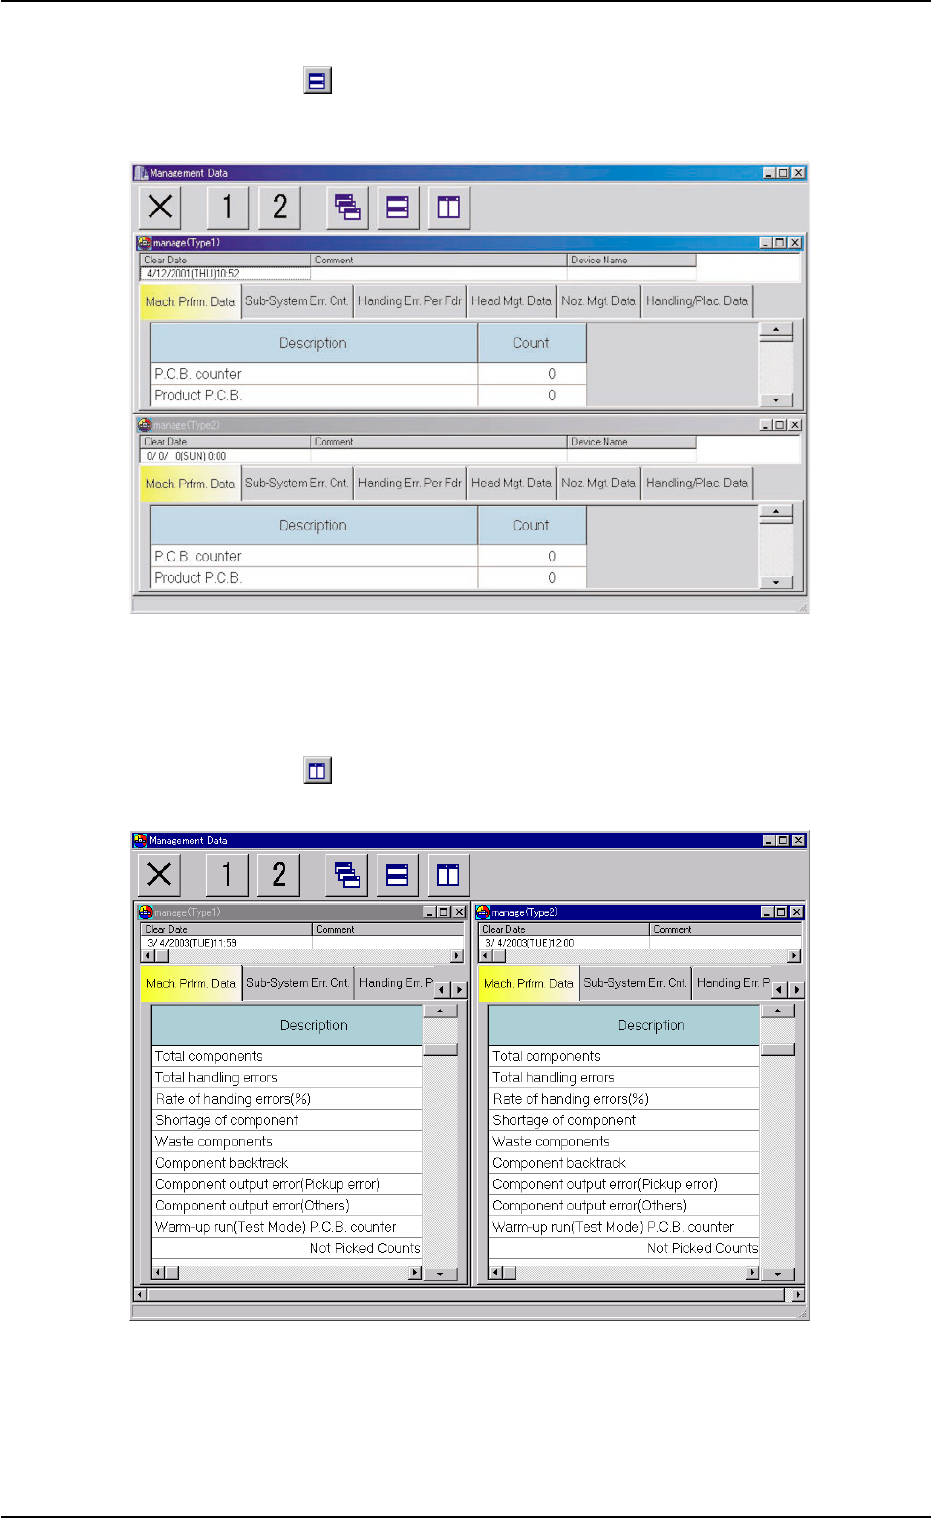
(4) Tile Horizontally
When the "
" icon is pressed, the "manage (Type1)" and "man-
age (Type2)" windows are re-arranged up and down.
Fig. 3D7 Horizontally Tiled "manage (Type1)" and "manage (Type2)" Windows
(5) Tile Vertically
When the "
" icon is pressed, the "manage (Type1)" and "man-
age (Type2)" windows are re-arranged side by side.
Fig. 3D8 Vertically Tiled "manage (Type1)" and "manage (Type2)" Windows
0403-002 4-13
AIM01EDTP
3.1 Basic Operations in "Management Data" Window
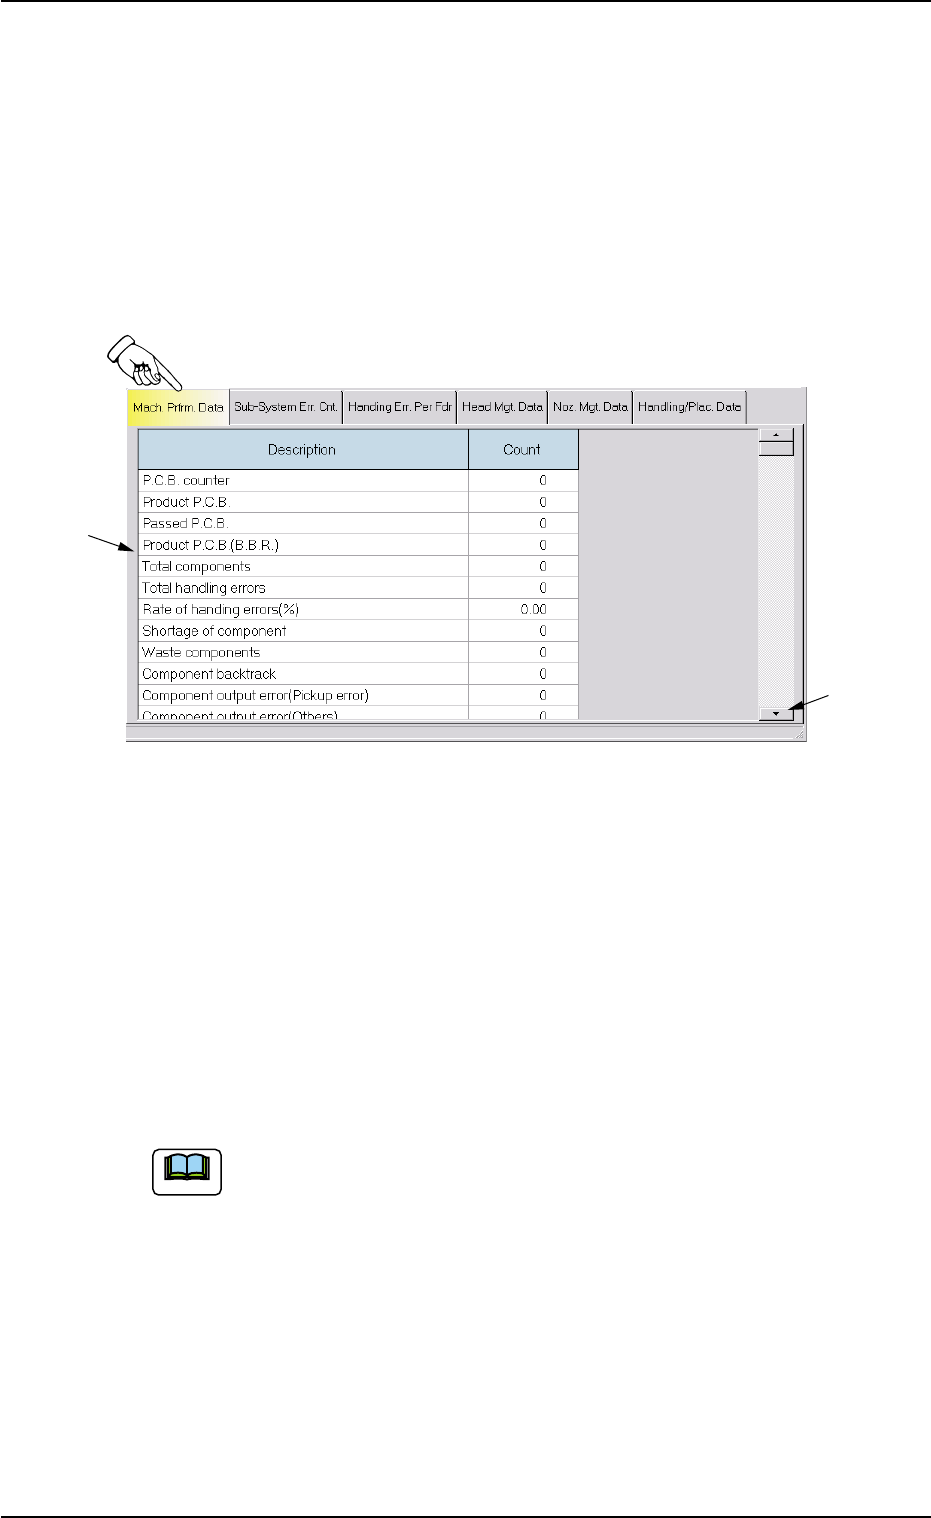
3.2 "Machine Performance Data" Tab
The corresponding tab sheet enables the operator to view the informa-
tion on machine performance.
• Sheet Layout
When the "Machine Performance Data" tab is pressed in the "Man-
agement Data" window, the following tab sheet appears inside the
window.
Fig. 3D9 "Machine Performance Data" Tab Sheet
• Sheet Composition
*1 Items
The following items are displayed.
(1) P.C.B. counter
Shown is the number of produced P.C.B.’s.
Counting is implemented when the X/Y table is zeroed after com-
ponent placement operation (when a P.C.B. is finished).
When a pattern program is set several times as the current
program, the sum total is computed.
(2) Product P.C.B.
The number of produced unit P.C.B.’s on a multi-unit P.C.B. is
summed up. Counting is implemented when a unit P.C.B. is fin-
ished and the X/Y table returns to its origin.
When the unit P.C.B. B.B.R. detection function (option) is used,
defective unit P.C.B.'s are excluded.
3.2 "Machine Performance Data" Tab
0403-002 4-14 AIM01EDTP
*1
*2
Note

(3) Passed P.C.B.
The number of passed P.C.B.’s is counted when the machine is
set in the "PASS" mode.
Counting is implemented when the P.C.B. transfer starts (when a
P.C.B. on the X/Y table is transferred to the output conveyor).
(4) Product P.C.B. (B.B.R.)
Shown is the number of defective P.C.B.'s summed up when the
unit P.C.B. B.B.R. detection function (option) is used.
(5) Total components
Shown is the number of picked components (the number of pick-
up operations).
(6) Total handling errors
Shown is the total number of component handling errors.
(7) Rate of handling errors (%)
Shown is the percentage of handling errors per total number of
picked components.
(8) Shortage of component
Shown is the total number of detected component shortage er-
rors.
(9) Waste components
Shown is the total number of components that were picked up
but not placed.
The indicated number of components represents the compo-
nents that were not placed due to a vertical component error
(sensor), a component recognition error, a component thick-
ness error, interrupted production, the detection of unit P.C.B.
(B.B.R.) (option), etc.
(10) Component backtrack
Shown is the total number of component backtrack errors.
(11) Component output error (Pickup error)
Shown is the total number of the output-error-caused compo-
nents (pickup errors).
(12) Component output error (Others)
Shown is the total number of output-error-caused components
(errors other than pickup ones).
3.2 "Machine Performance Data" Tab
0510-003 4-15 AIM01EDTP
Note