3OM-996-005.pdf - 第245页
3point errors (% of T otal P .E.C. recog. errors) Shown are the total number of errors detected on the third fiducial mark and the percentage of the detected errors per total number of all errors detected by the P .E.C. …

(18) Total handling errors/Total components
Shown are the total number of pick-up errors, the total number of
components to be picked up, and the percentage of pick-up er-
rors per total number of picked components.
A: comp. missing (% of Total handling errors)
Shown are the number of component missing errors detected by
the linear measure detection photosensor and the percentage of
component missing errors per total number of pick-up errors.
B: comp. missing (% of Total handling errors)
Shown are the number of component missing errors detected in
the recognition process and the percentage of component miss-
ing errors per total number of pick-up errors.
C: comp. vertical (% of Total handling errors)
Shown are the number of vertical components detected by the
linear measure detection photosensor and the percentage of ver-
tical component errors per total number of pick-up errors.
D: comp. recog. (% of Total handling errors)
Shown are the number of errors detected in the recognition pro-
cess and the percentage of errors per total number of pick-up
errors.
E: comp. thick (% of Total handling errors)
Shown are the number of errors in component thickness detected
by the linear measure detection photosensor and the percentage
of errors per total number of pick-up errors.
F: pick-up diff (% of Total handling errors)
Shown are the number of pick-up difference errors detected in
the recognition process and the percentage of the errors per total
number of pick-up errors.
G: comp. reverse (% of Total handling errors)
Shown are the number of reversed component errors detected in
the recognition process and the percentage of the errors per total
number of pick-up errors.
Total handling errors
Shown is the total number of pick-up errors.
1point errors (% of Total P.E.C. recog. errors)
Shown are the total number of errors detected on the first fiducial
mark and the percentage of the detected errors per total number
of all errors detected by the P.E.C. recognition function.
2point errors (% of Total P.E.C. recog. errors)
Shown are the total number of errors detected on the second
fiducial mark and the percentage of the detected errors per total
number of all errors detected by the P.E.C. recognition function.
0403-002 4-18
AIM01EDTP
3.2 "Machine Performance Data" Tab

3point errors (% of Total P.E.C. recog. errors)
Shown are the total number of errors detected on the third fiducial
mark and the percentage of the detected errors per total number
of all errors detected by the P.E.C. recognition function.
Local fiducial errors (% of Total P.E.C. recog. errors)
Shown are the total number of individual P.E.C. recognition errors
and the percentage of the detected errors per total number of all
errors detected by the P.E.C. recognition function.
Total P.E.C. recognition errors
Shown is the total number of errors detected by the P.E.C. recog-
nition function.
The number of errors detected by the global P.E.C. recognition
function and the total number of errors detected by the B.B.R.
recognition function are displayed.
*2 Vertical Scroll Bar
Scroll arrows are located at both ends of a scroll bar. The up or the
down arrow can be pressed to scroll up or down a tab sheet to
expose hidden items.
3.2 "Machine Performance Data" Tab
0305-001 4-19 AIM01EDTP
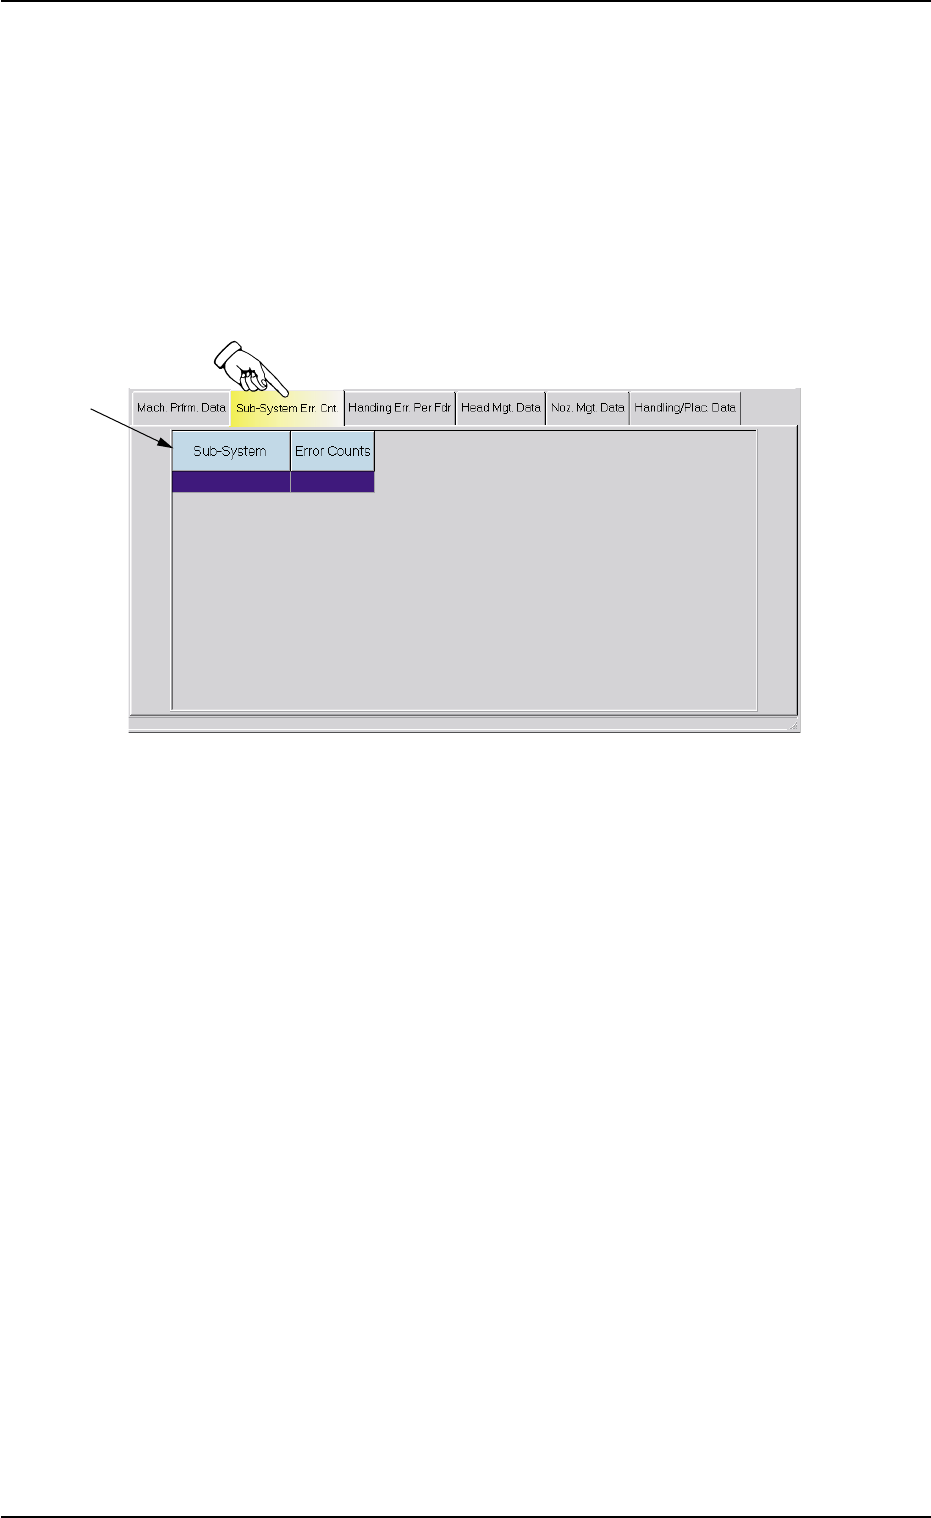
3.3 "Sub-System Error Counts" Tab
The corresponding tab sheet enables the operator to view the total num-
ber of errors that occurred on each device during automatic operation.
• Sheet Layout
When the "Sub-System Error Counts" tab is pressed in the "Manage-
ment Data" window, the following tab sheet appears inside the window.
Fig. 3D10 "Sub-System Error Counts" Tab Sheet
• Sheet Composition
*1 Items
The following items are displayed.
(1) Sub-System
Shown is the device on which an error occurred.
(2) Error Counts
Shown is the total number of errors that occurred on the device.
• How to view the details
When the device line is pressed to view the details, the "Details" win-
dow opens.
The "Details" window displays the number of errors that have oc-
curred in each error-caused spot of the selected device.
When the [OK] button is pressed in the "Details" window, the "De-
tails" window closes.
0305-001 4-20
AIM01EDTP
*1
3.3 "Sub-System Error Counts" Tab