OperationInstruction_Vsision XP.pdf - 第165页
V ISION XP+ V AC Page 157 6 Rehm Recorder 6.2 Live mode configuration Operating Instructions V ersion 1.5 6.2.3 Se lect data points Fig. 6-7 Select data poin t 1 A) Clicking a switch a ctivates the data p oints. The swit…
Page 156 VISION XP+ VAC
6 Rehm Recorder
6.2 Live mode configuration
Operating Instructions
Version 1.5
above or below which the trigger starts recording.
For a time trigger, specify the time recording starts.
It is possible for both trigger types to configure start and end triggers.
Fig. 6-5 Next button
This button moves on to the next
settings.
Fig. 6-6 Back button
This button moves back to the pre-
vious screens.
VISION XP+ VAC Page 157
6 Rehm Recorder
6.2 Live mode configuration
Operating Instructions
Version 1.5
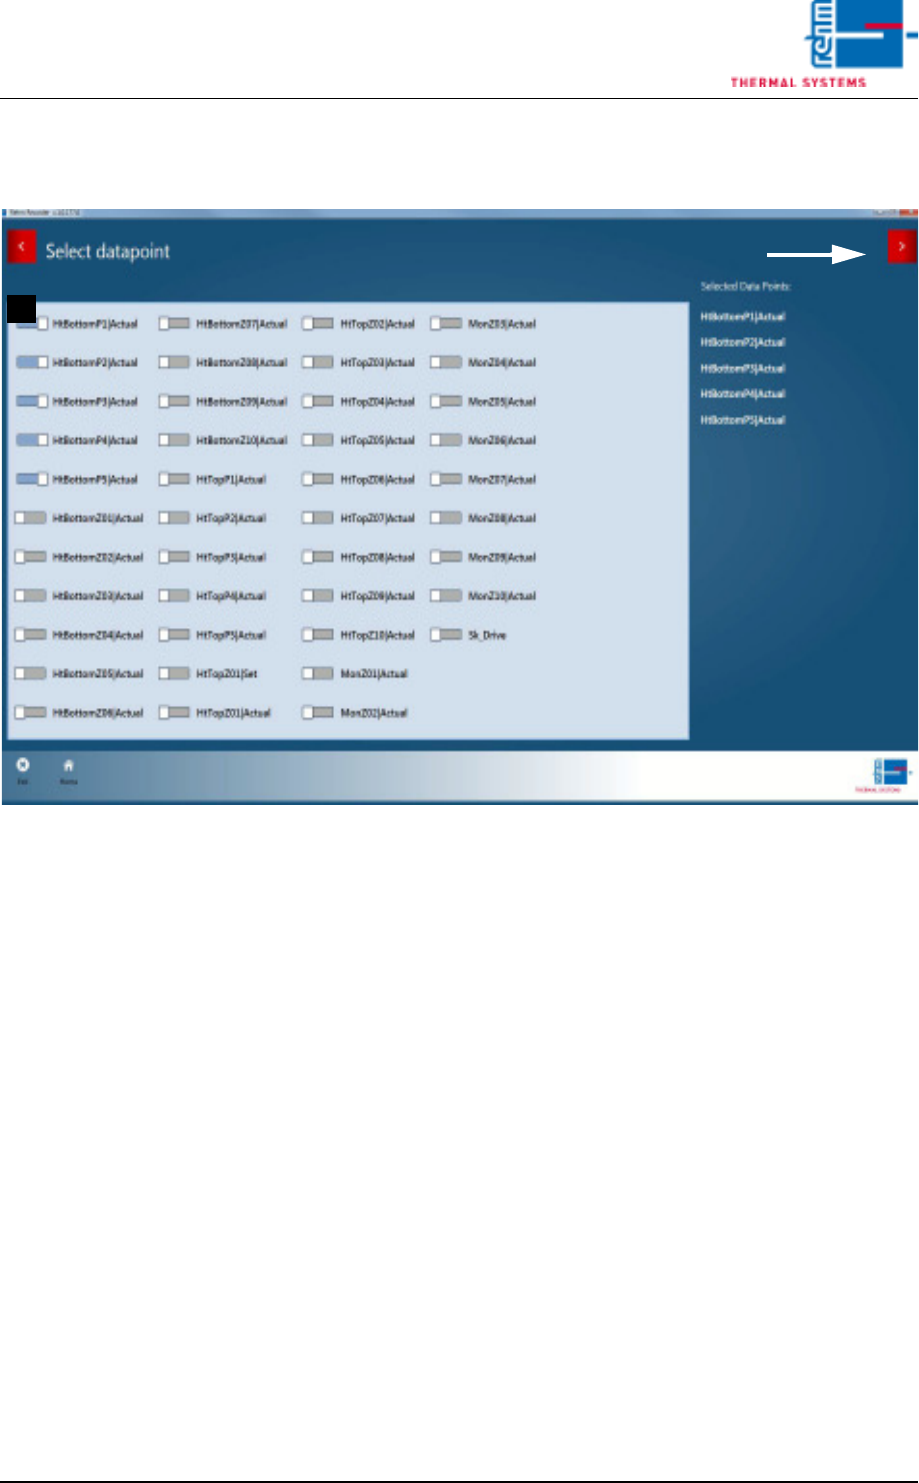
6.2.3 Select data points
Fig. 6-7 Select data point 1
A) Clicking a switch activates the data points. The switch then turns blue
and the data point is shown on the far right in the list.
This is where all data points selected are displayed. Once a data point is
activated, a new list can be selected and additional data points activated.
The ">" arrow takes the user to the next input screen.
A
Page 158 VISION XP+ VAC
6 Rehm Recorder
6.2 Live mode configuration
Operating Instructions
Version 1.5
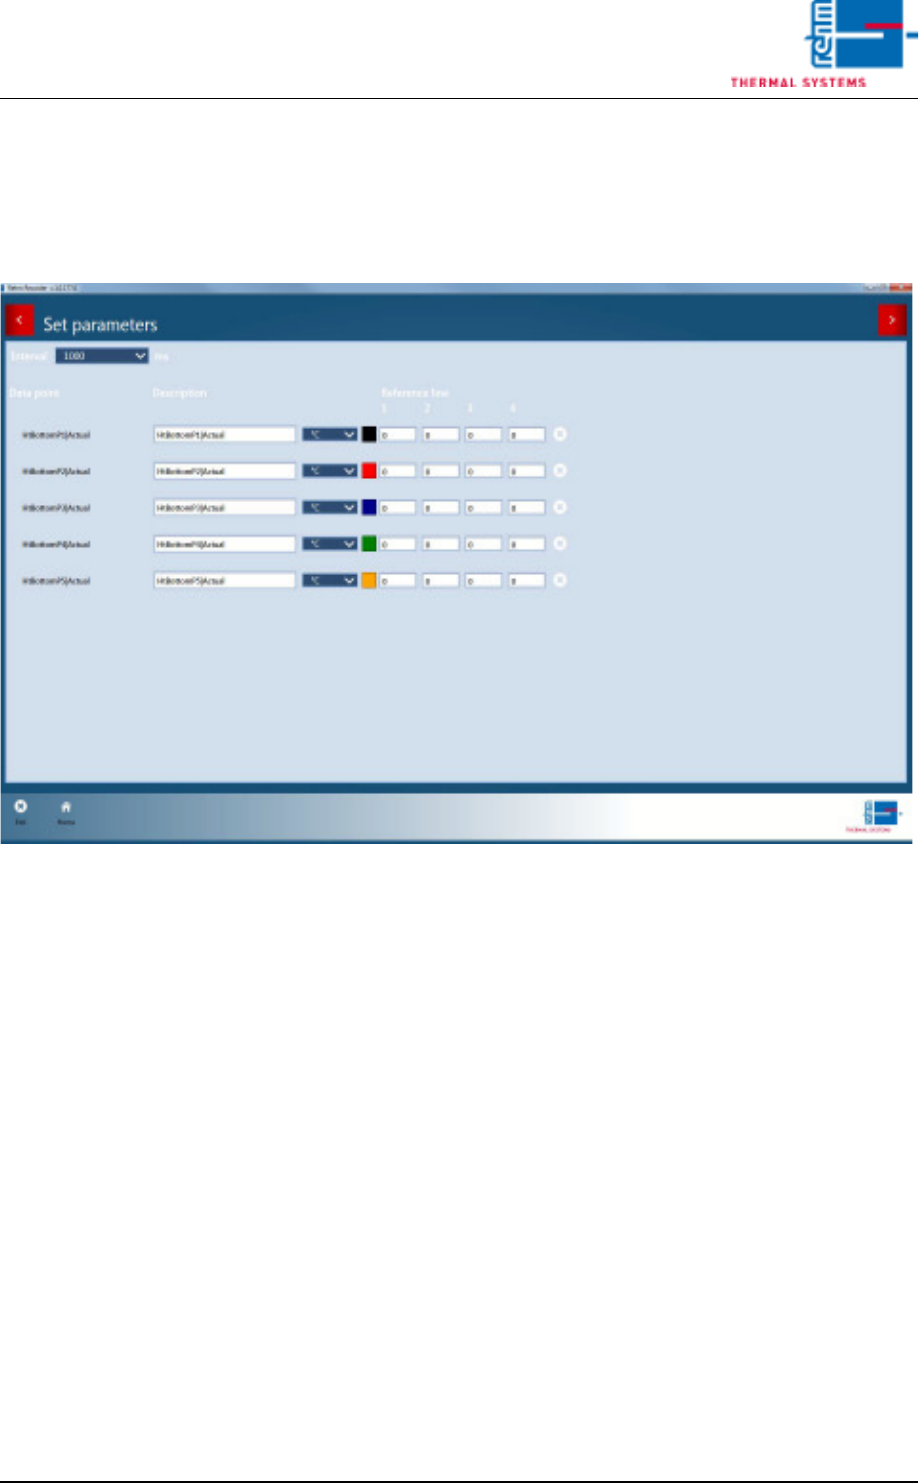
6.2.4 Set parameters
The recording interval for all data points (in milliseconds) can be set from this
screen.
Fig. 6-8 Set parameters 1
Names of data points can be changed directly in the fields. The selection of
the associated unit can be changed from the selection list. The assignment
to a unit decides the axis to which the data point is assigned in the chart.
Boundary lines are plotted on the chart with values 1, 2, 3 and 4. These
boundary lines are shown in the same colour as the data point.
The "x" at the end of every row deletes the respective data point from the
configuration.
Clicking a colour opens a colour selection in which the colour of a data point
in the chart can be chosen.