OperationInstruction_Vsision XP.pdf - 第172页
Page 164 V ISION XP+ V AC 6 Rehm Recorder 6.3 Chart Operating Instructions V ersion 1.5 Fig. 6-1 7 View data recording 1 The legend is expa nded out fully . The follo wing buttons are s hown: A) End The "End" b…
VISION XP+ VAC Page 163
6 Rehm Recorder
6.3 Chart
Operating Instructions
Version 1.5
6.3 Chart
6.3.1 View data recording
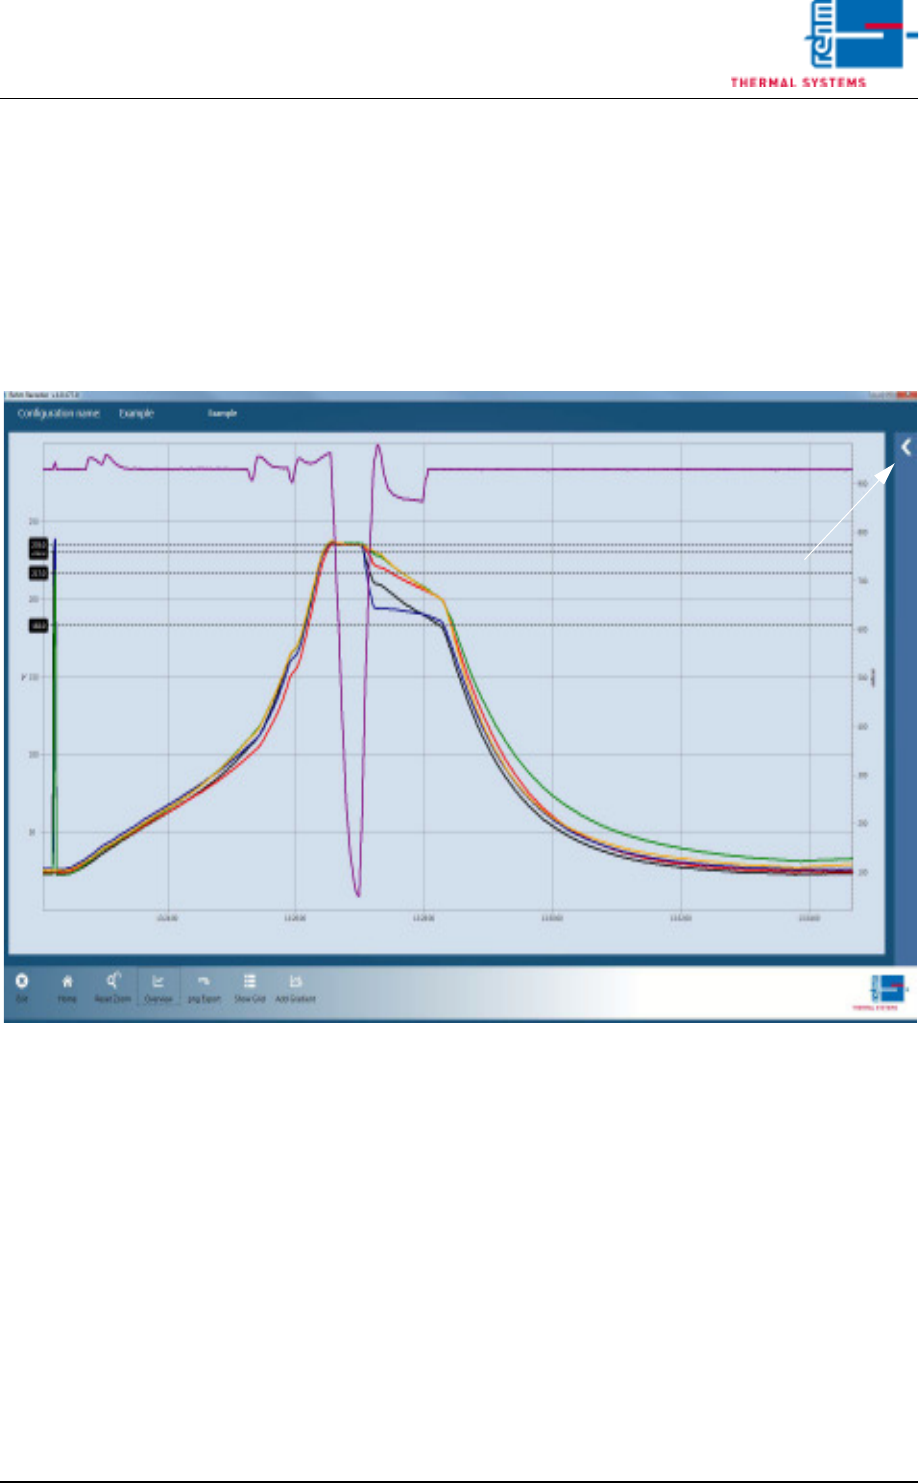
The data recording starts with the following view.
Pressing the arrow displayed opens the legend.
Fig. 6-16 Data recording 1
Page 164 VISION XP+ VAC
6 Rehm Recorder
6.3 Chart
Operating Instructions
Version 1.5
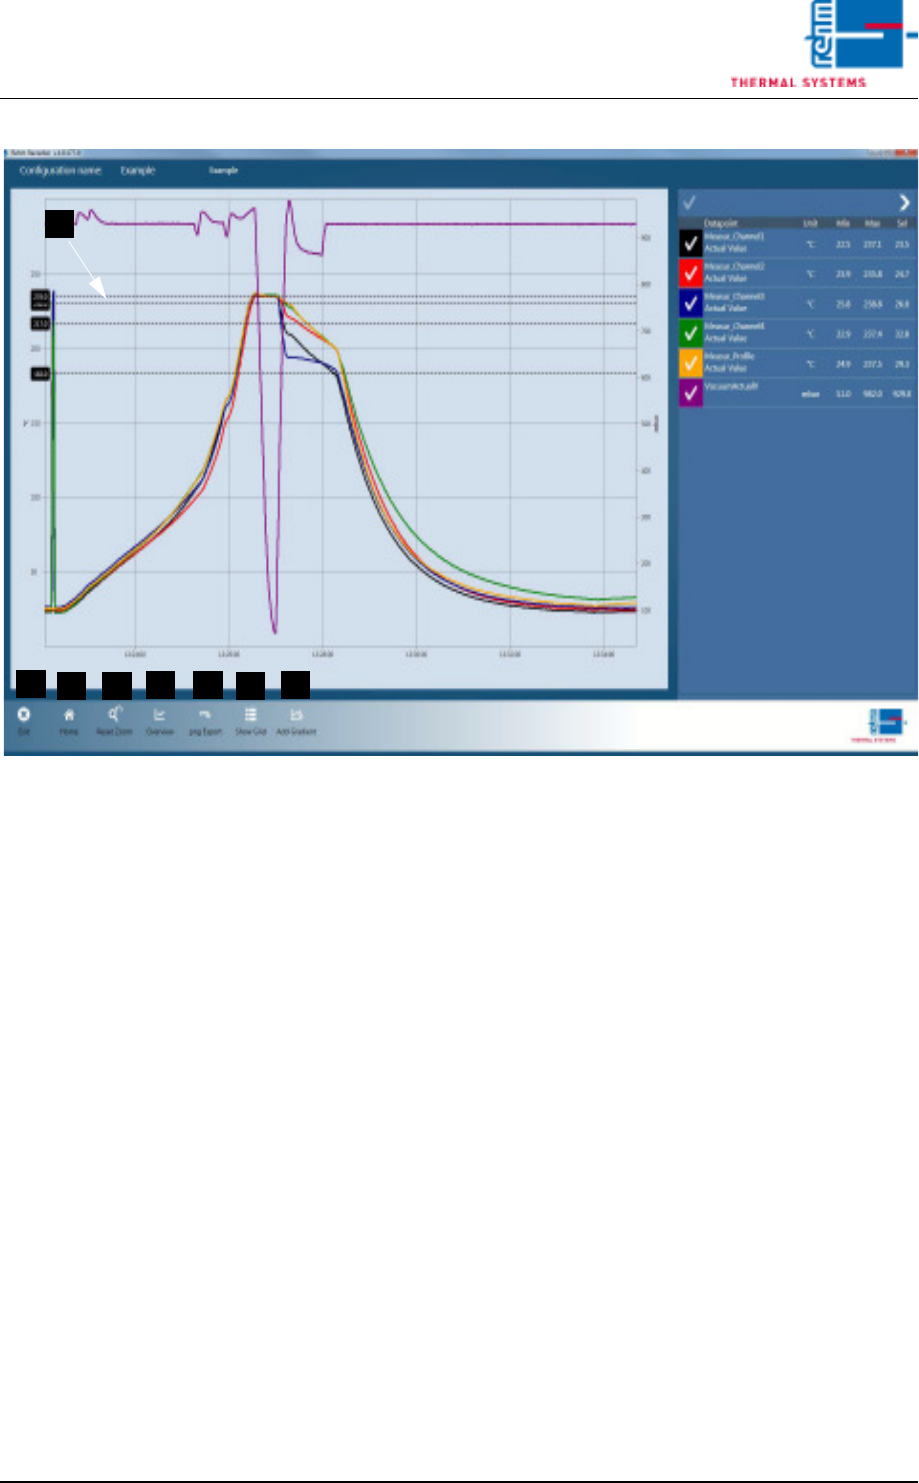
Fig. 6-17 View data recording 1
The legend is expanded out fully. The following buttons are shown:
A) End
The "End" button closes the application.
B) Home
The "Home" button skips the recording when cancel recording is con-
firmed by the user.
C) Reset Zoom
The "Reset zoom" button sets the chart scaling to its original values. The
values stored in the settings are meant by original values.
D) Overview
The entire measurement is shown on the screen.
E) png Export
The "png Export" button exports an image in the current chart to the de-
fault path that is saved in the settings and is in subfolder "ChartExports".
F) Show Grid
The grid display is the tabular view of values.
G) Add Gradient
Adding a gradient shows the two black longwise lines, and the associated
legend in the bottom right of the screen.
H) The black crosslines are the thresholds configured for the data point.
Ticking a data point in the chart hides it.
B
D
C
A
E
F
G
H
VISION XP+ VAC Page 165
6 Rehm Recorder
6.3 Chart
Operating Instructions
Version 1.5
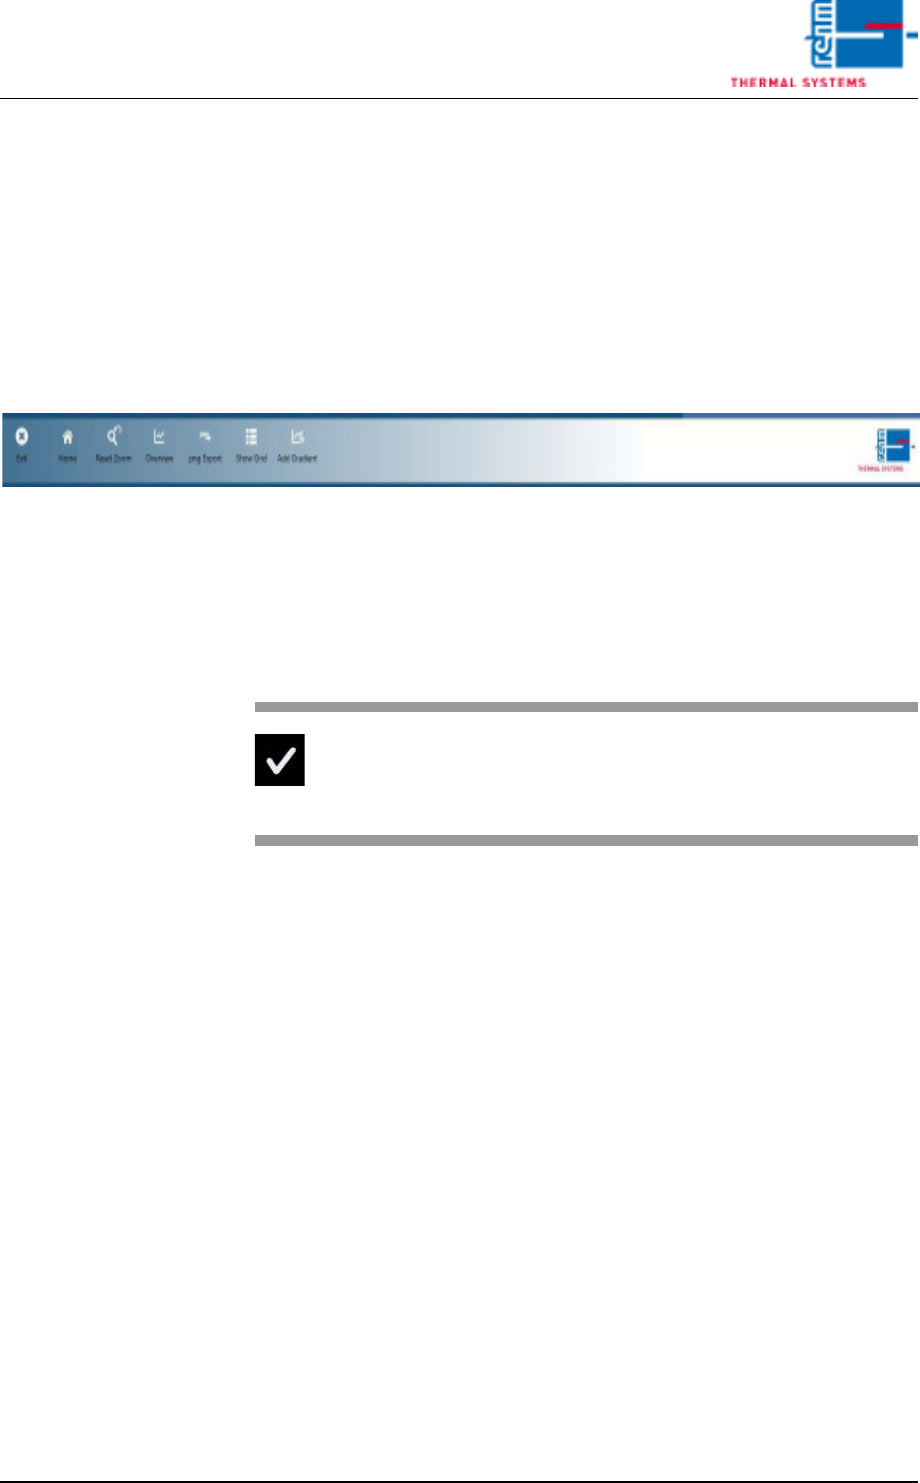
Pause
The "Pause" button pauses the display of new values. Values continue to be
recorded in the background. The view in the chart is frozen.
Stop
The "Stop" button stops recording of data points. This cannot be undone (a
warning message is also shown underneath the chart).
Recording then needs to be started anew. The files recorded are stored as
Zip files on the default path defined in the settings, in subfolder "Recorded-
Files".
Fig. 6-18 Data recording legend
6.3.2 Checkbox
Use the checkbox to control the visibility of a data point in the chart.
Fig. 6-19 Checkbox ticked
If this is ticked, the data point is
shown in the chart.