OperationInstruction_Vsision XP.pdf - 第174页
Page 166 V ISION XP+ V AC 6 Rehm Recorder 6.3 Chart Operating Instructions V ersion 1.5 6.3.3 Selected data point value The " selected " value is understood to be th e value shown by th e vertical dotted line. …
VISION XP+ VAC Page 165
6 Rehm Recorder
6.3 Chart
Operating Instructions
Version 1.5
Pause
The "Pause" button pauses the display of new values. Values continue to be
recorded in the background. The view in the chart is frozen.
Stop
The "Stop" button stops recording of data points. This cannot be undone (a
warning message is also shown underneath the chart).
Recording then needs to be started anew. The files recorded are stored as
Zip files on the default path defined in the settings, in subfolder "Recorded-
Files".
Fig. 6-18 Data recording legend
6.3.2 Checkbox
Use the checkbox to control the visibility of a data point in the chart.
Fig. 6-19 Checkbox ticked
If this is ticked, the data point is
shown in the chart.

Page 166 VISION XP+ VAC
6 Rehm Recorder
6.3 Chart
Operating Instructions
Version 1.5
6.3.3 Selected data point value
The "selected" value is understood to be the value shown by the vertical
dotted line. This line moves with the current data point.
Moving the cursor into the chart causes the line to jump to the cursor and the
data for the current position to be shown. You must move the cursor out of
the chart area if you want to display the current data point again.
The value "selected" is displayed for all data points configured and activat-
ed.
6.3.4 Zoom chart
Keeping the left mouse button pressed opens a zoom window that zooms
the selected area onto the full chart window.
6.3.5 Move chart
Keeping the right mouse button pressed enables the chart to be moved in all
directions.
VISION XP+ VAC Page 167
6 Rehm Recorder
6.3 Chart
Operating Instructions
Version 1.5
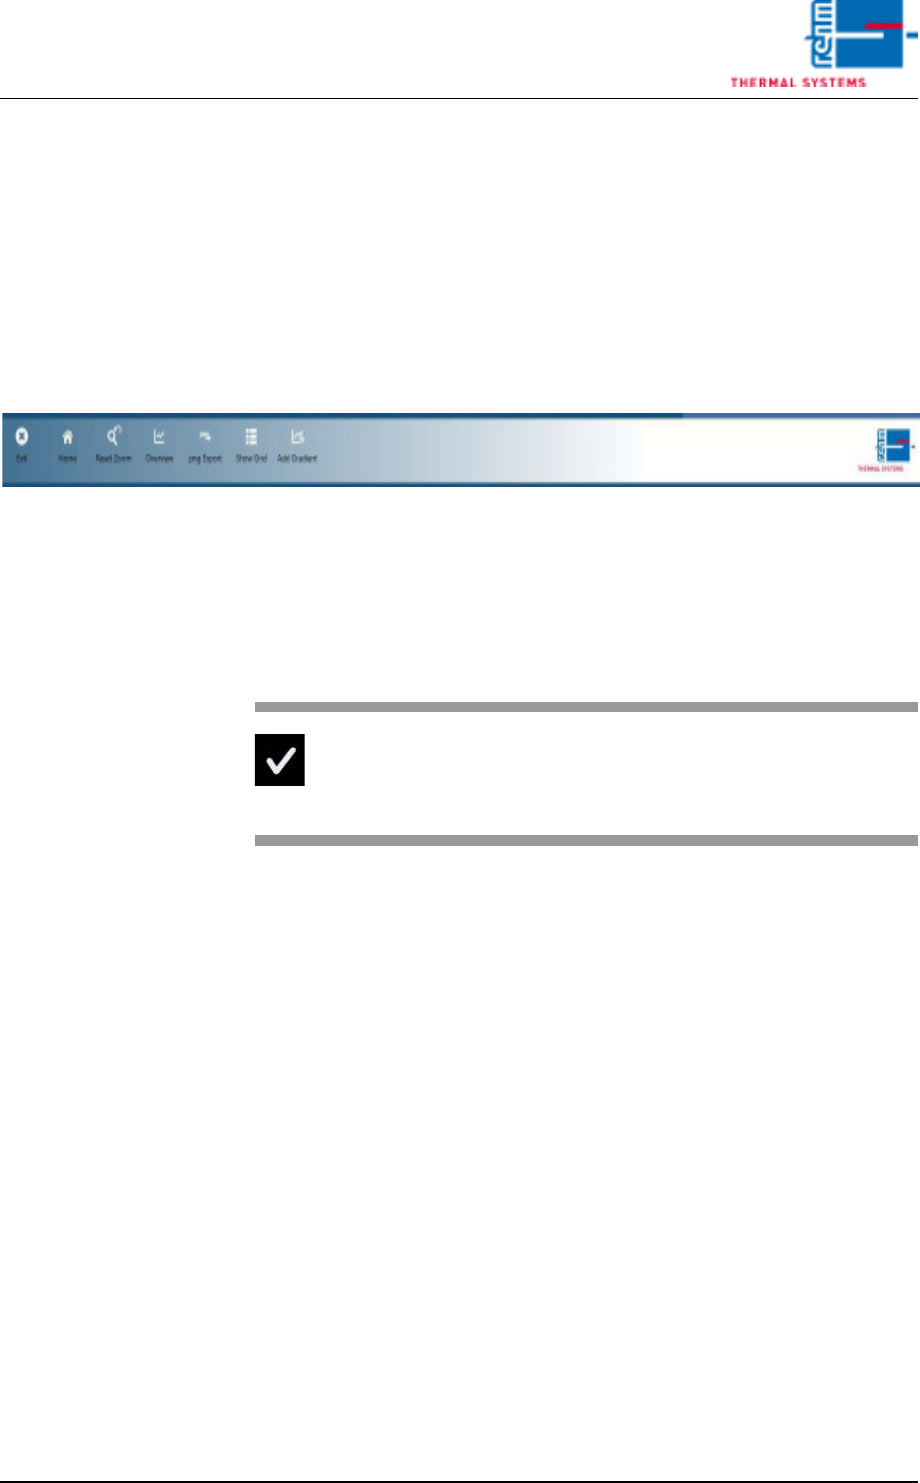
6.3.6 Calculate gradient
When recording has been paused, clicking the "Add Gradient" button en-
ables a gradient to be plotted.
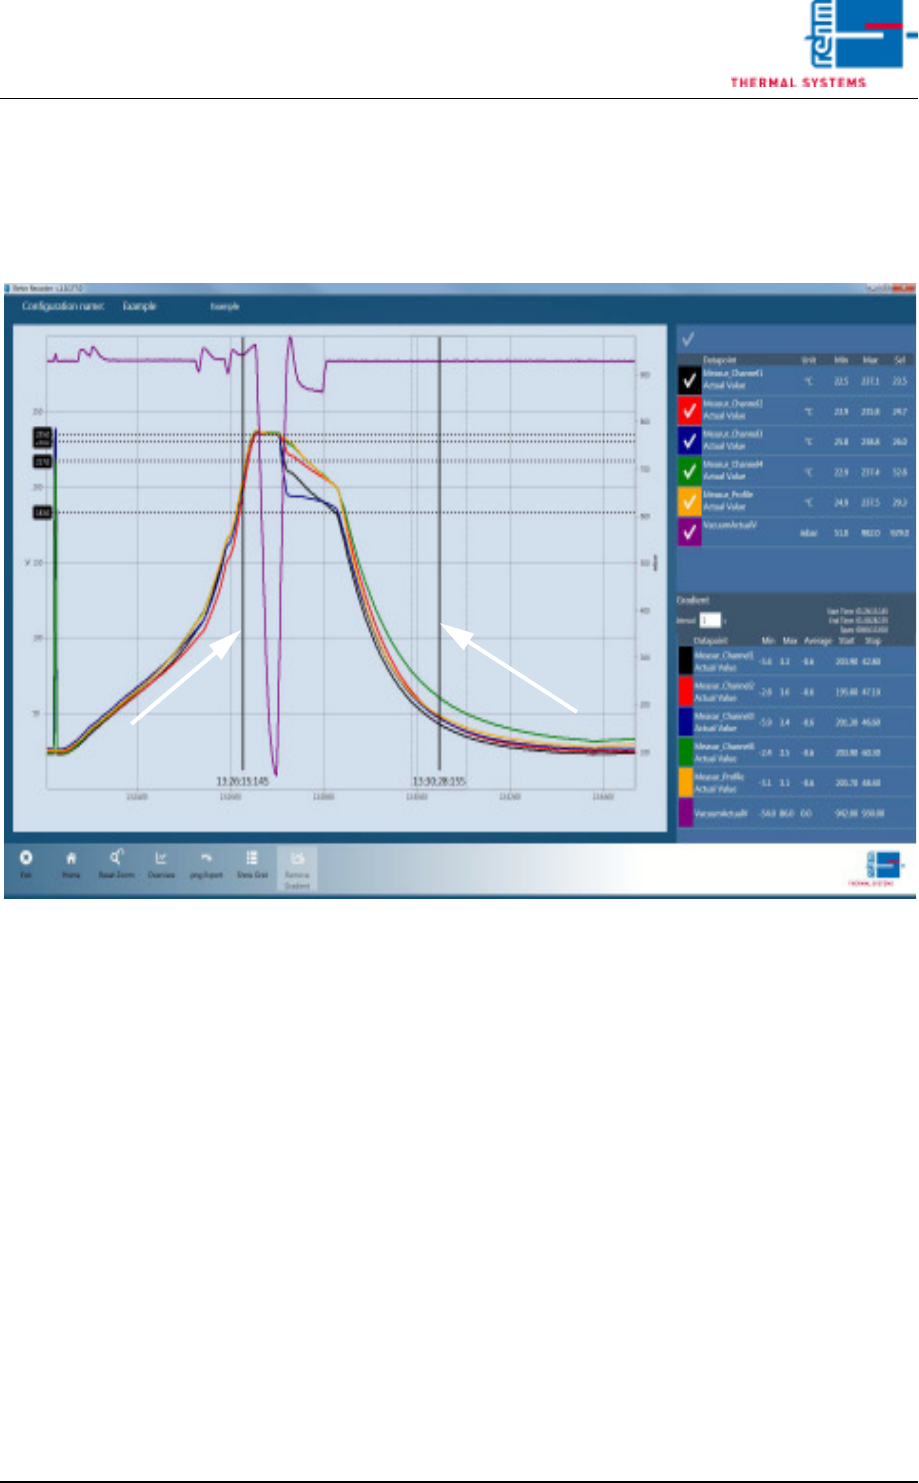
Fig. 6-20 Calculate gradient
For this, two black bars are shown that can be moved to the correct position
on the chart with the mouse.
The values calculated are then shown in the legend under "Gradient". An
"interval" (in seconds) during which the gradient is calculated can be set in
addition.
6.3.7 Close chart legend
Re-clicking the right arrow (">") in the legend collapses the legend.