HS50_advance_level 2.pdf - 第302页
07/2002 Editio n Student G uide HS -50 Advanc ed II 9 Z-Axis 42 A tende ncy for the axis to vi brate is illust rated in Figur e Fig. 9.6 - 13. The oscil loscope settings ar e the same as in Fig. Fig. 9 .6 - 12. – Slowly …
Student Guide HS-50 Advanced II 07/2002 Edition
9 Z-Axis
41
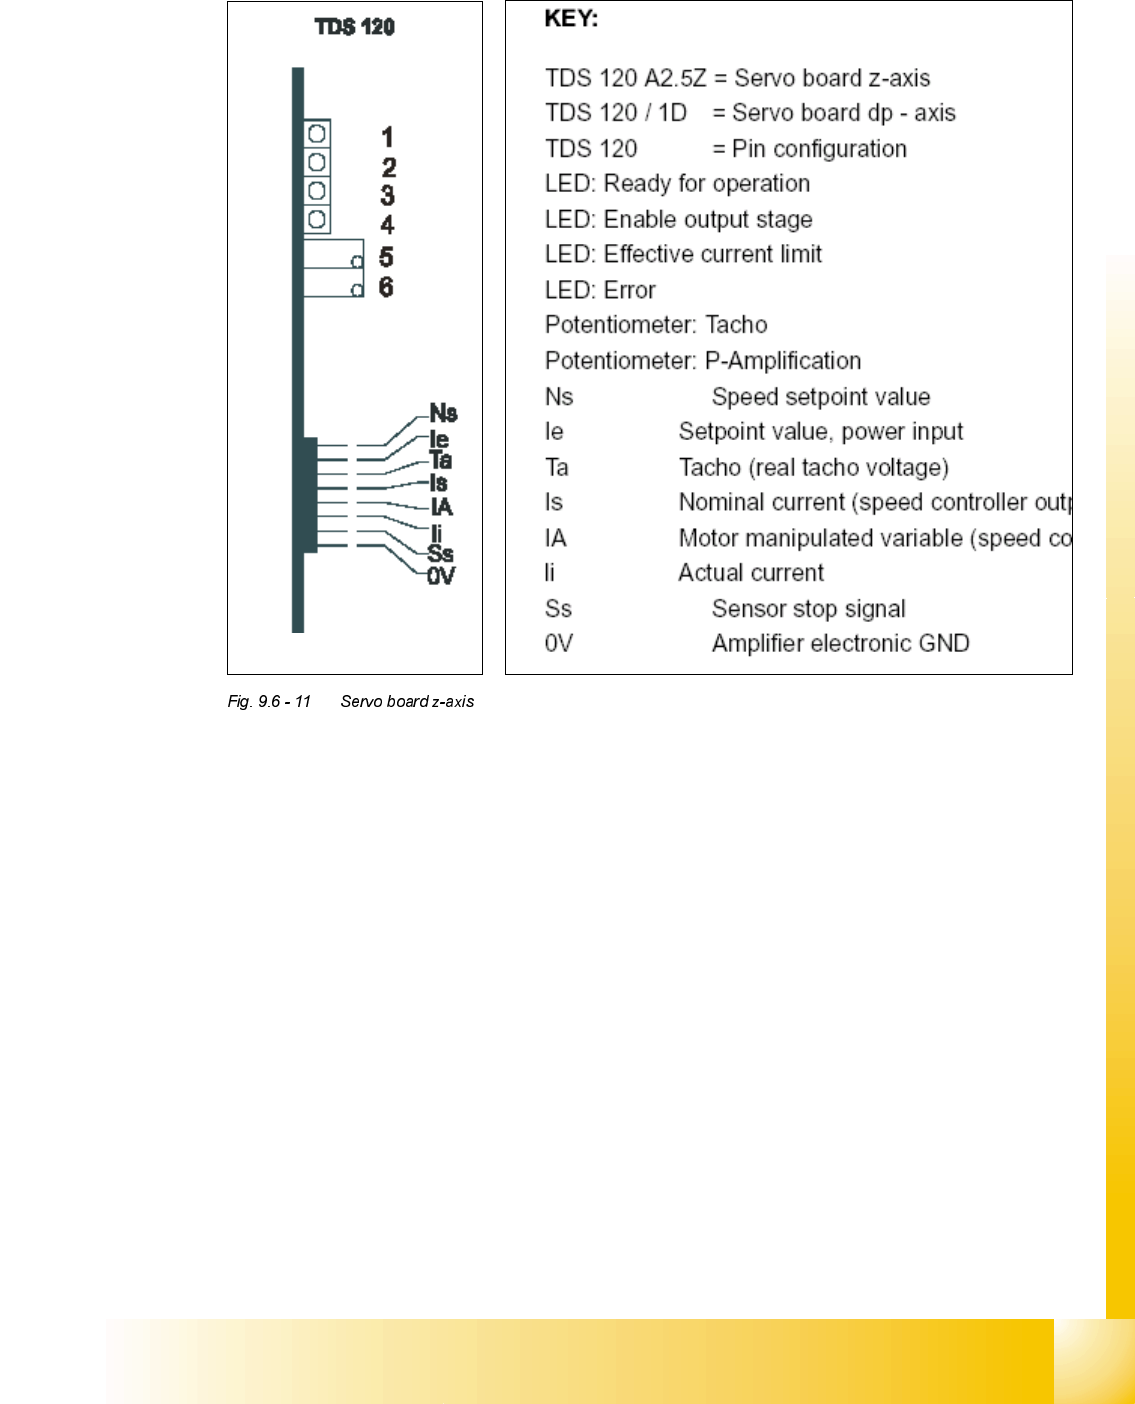
Examine the tacho signal in the region of the falling edge of the end signal, and make the following
settings on the oscilloscope:
Tacho signal:
Voltage 200 mV/Div
Time base 5 msec
End signal:
Voltage 5 V/Div
Time base 5 msec
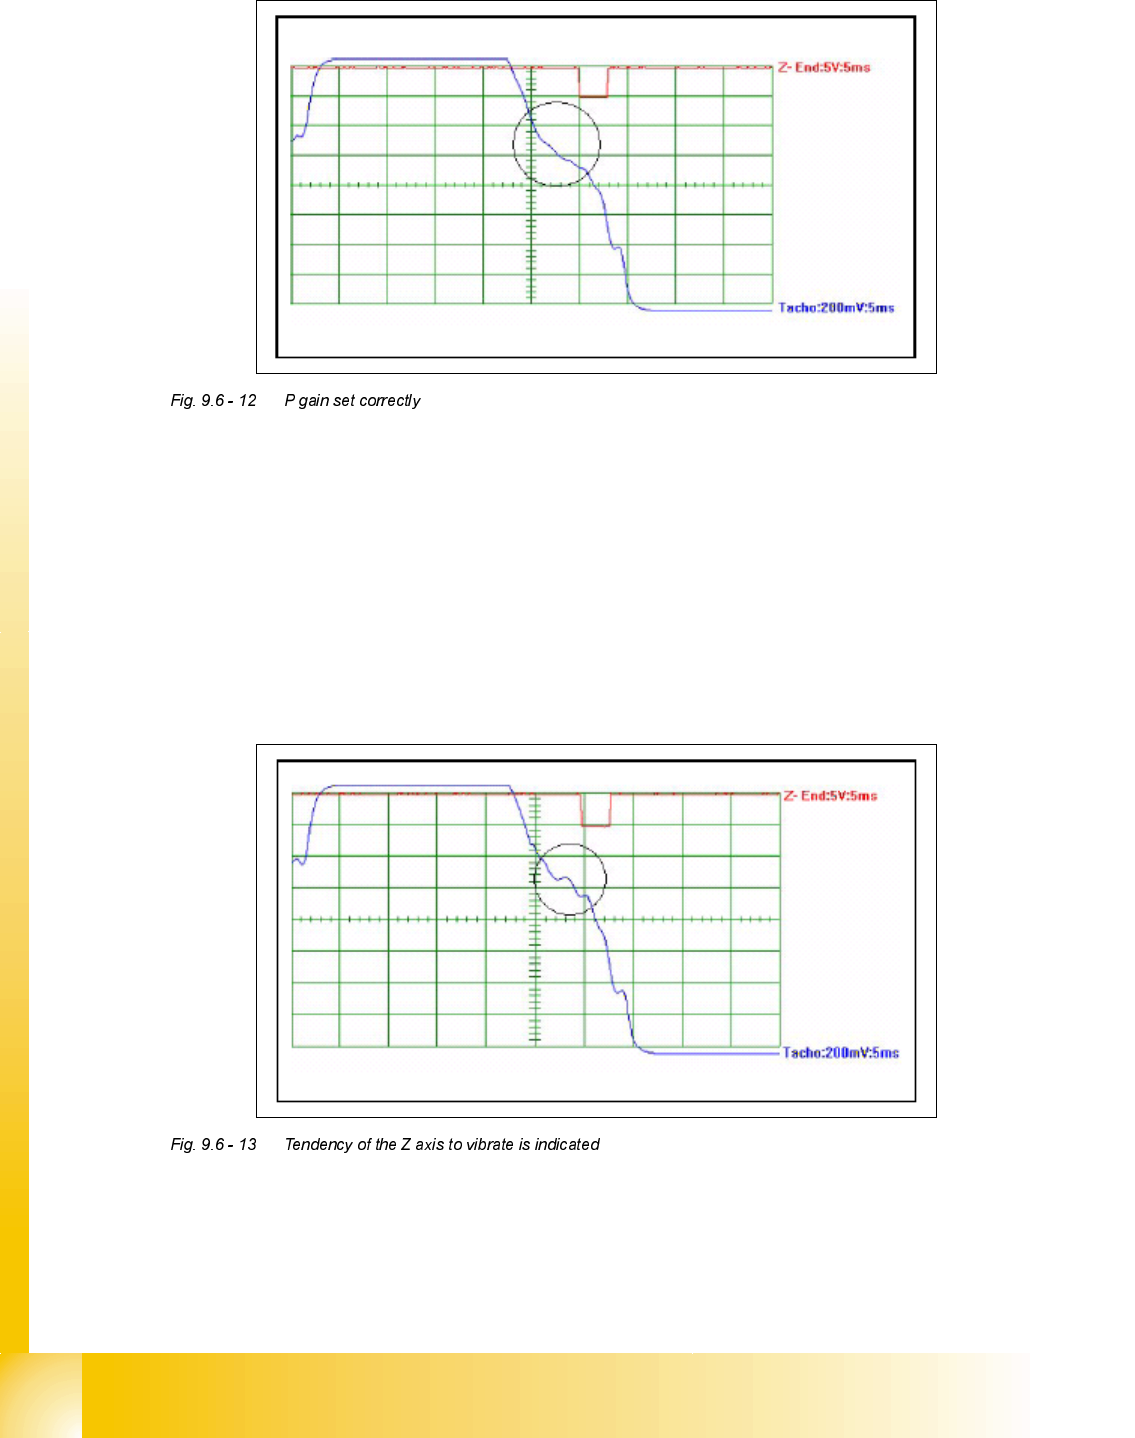
Fig. 7.6 - 4 shows an oscillogram with the P-gain set correctly. The tacho signal curve drops
continuously in the region of the falling edge of the end signal.
07/2002 Edition Student Guide HS-50 Advanced II
9 Z-Axis
42
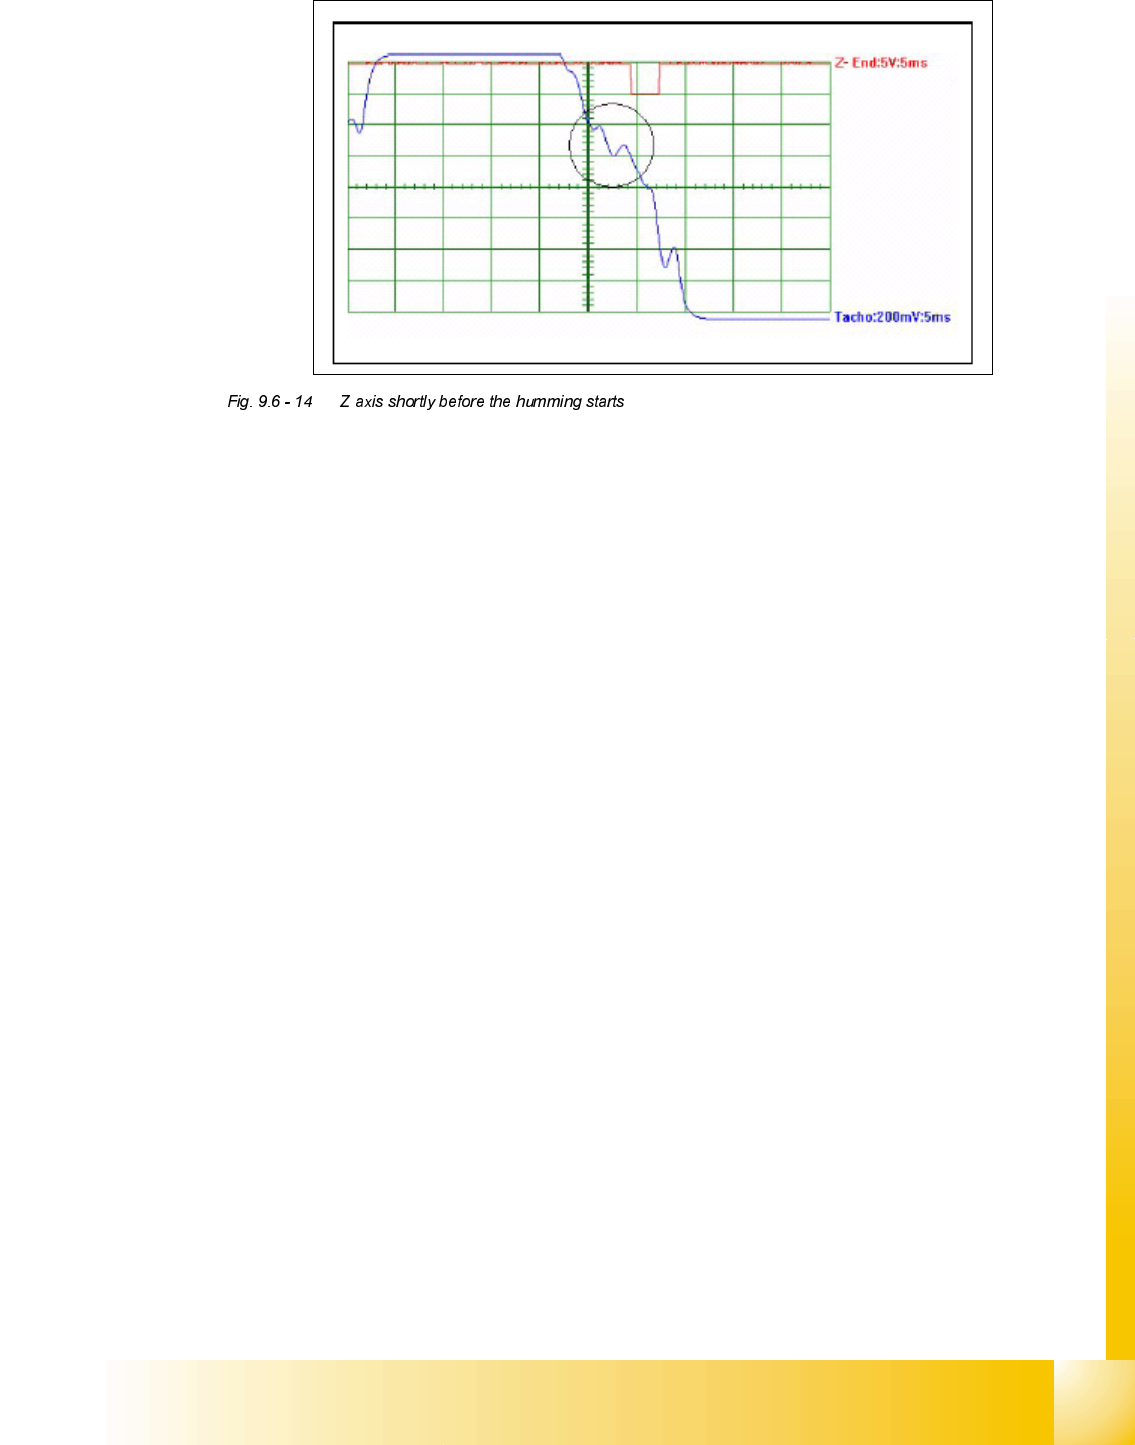
A tendency for the axis to vibrate is illustrated in Figure Fig. 9.6 - 13.
The oscilloscope settings are the same as in Fig. Fig. 9.6 - 12.
– Slowly increase the P gain by turning the potentiometer on the servo-amplifier board. With the
tacho signal, a dip or peak starts in the vicinity of the falling edge of the end signal
(see Fig. 9.6 - 13). The axis speed rises again shortly before the final position is reached. This
is an indicator that the axis has a tendency to vibrate. The axis no longer reaches its desired
position with the required repeat accuracy. The pick-up error rate rises.
– If the P gain is increased further, more dips and peaks occur (see Fig.7.6 - 6). The pick-up error
rate rises sharply. Finally, the axis vibrates to such an extent that a humming sound can be
heard.
Student Guide HS-50 Advanced II 07/2002 Edition
9 Z-Axis
43
– Use the SITEST program to check the tacho signal curve once more as described.