EUKYX-199-2100_G5S2_Instruction_Vol2_E.pdf - 第198页
EUKYX 4-6 199-2100 2.1 "Mach.Prfrm," T ab Sheet St op time Shown is the peri od of time dur in g whi ch component p l acement operati on was in terrupted for component replen is hment, etc. Error stop Shown is …
EUKYX
4-5199-2100
2.1 "Mach.Prfrm," Tab Sheet
[11]
[12]
[13]
F2D4
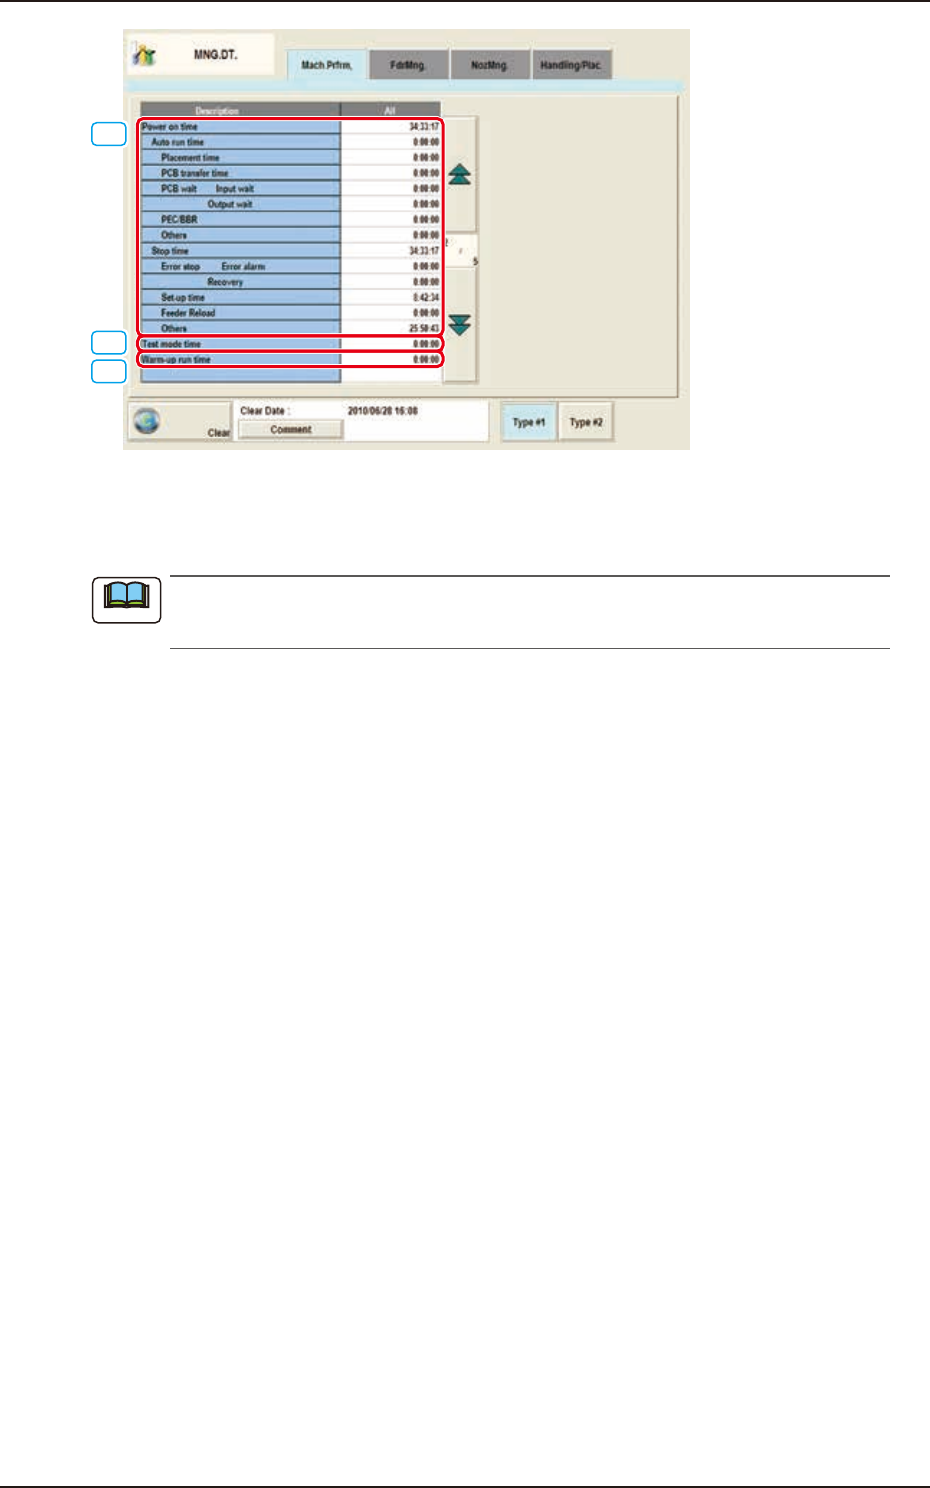
[11] Power on time
Shown is the period of time during which the control power of the machine was working.
Example:
10:03'50" (10 hours, 3 minutes, and 50 seconds)
Auto run time
Duration of machine operation during production. When a particular pattern program is set
several times for production, the sum total is computed.
Placement time
Shown is the time required to finish a PCB (from the first to the last component placement
on one product PCB). The essential component placement time is summed up. While the
machine is set in the "STOP" or the "PAUSE" mode or a step operation is performed, the time
is not measured. This is used to calculate the average placement tact time per component.
PCB transfer time
Shown is the period of time during which Conveyor NL, NR, NA, NB, and NC are being
activated.
PCB wait
Input wait
Shown is the period of time during which the machine was completely in the waiting mode
(the machine was waiting for a PCB to be loaded from the input machine).
Output wait
Shown is the period of time during which the machine was completely in the waiting mode
(the machine was waiting for a PCB to be unloaded to the output machine).
PEC/BBR
Shown is the period of time during which the machine is taking PEC recognition and BBR
detection actions.
Counted is the period of time during which the X/Y table starts moving and the PEC
recognition and BBR detection are completed.
Others
Shown is the period of time during which the X/Y beam takes actions before component
placement, the X/Y table returns after component placement, etc.
Note
EUKYX
4-6199-2100
2.1 "Mach.Prfrm," Tab Sheet
Stop time
Shown is the period of time during which component placement operation was interrupted
for component replenishment, etc.
Error stop
Shown is the total time period when the machine is stopped due to a machine error during
the operation or standby.
The time period of a machine error during maintenance or setup, except for automatic
operation, is not included.
Error alarm
Shown is the period of time during which an alarm (light tower ON) is issued.
Recovery
Shown is the time between error cancellation and restart of machine operation.
Maintenance time
Shown is the time period from pattern program change completion to machine status turned
to be "RUN"or "WAIT".
Feeder Reload
Shown is the machine stop time period from the occurrence of component shortage to
re-start of the machine.
Others
Shown is the time period during which the pattern program is changed or machine idling
operation is performed.
[12] Test mode time
Shown is the period of time during which test run was performed according to the test mode
parameters.
“Warm-up run time” is included.
[13] Warm-up run time
The running time is counted when the machine is operated under the following condition.
• “Test Mode” is enabled on the “Operation” window.
• The “PCB Transfer” is set to “Disable”. (State in which no PCB is put in and out)
Note
Note
EUKYX
4-7199-2100
2.1 "Mach.Prfrm," Tab Sheet
[14]
F2D5
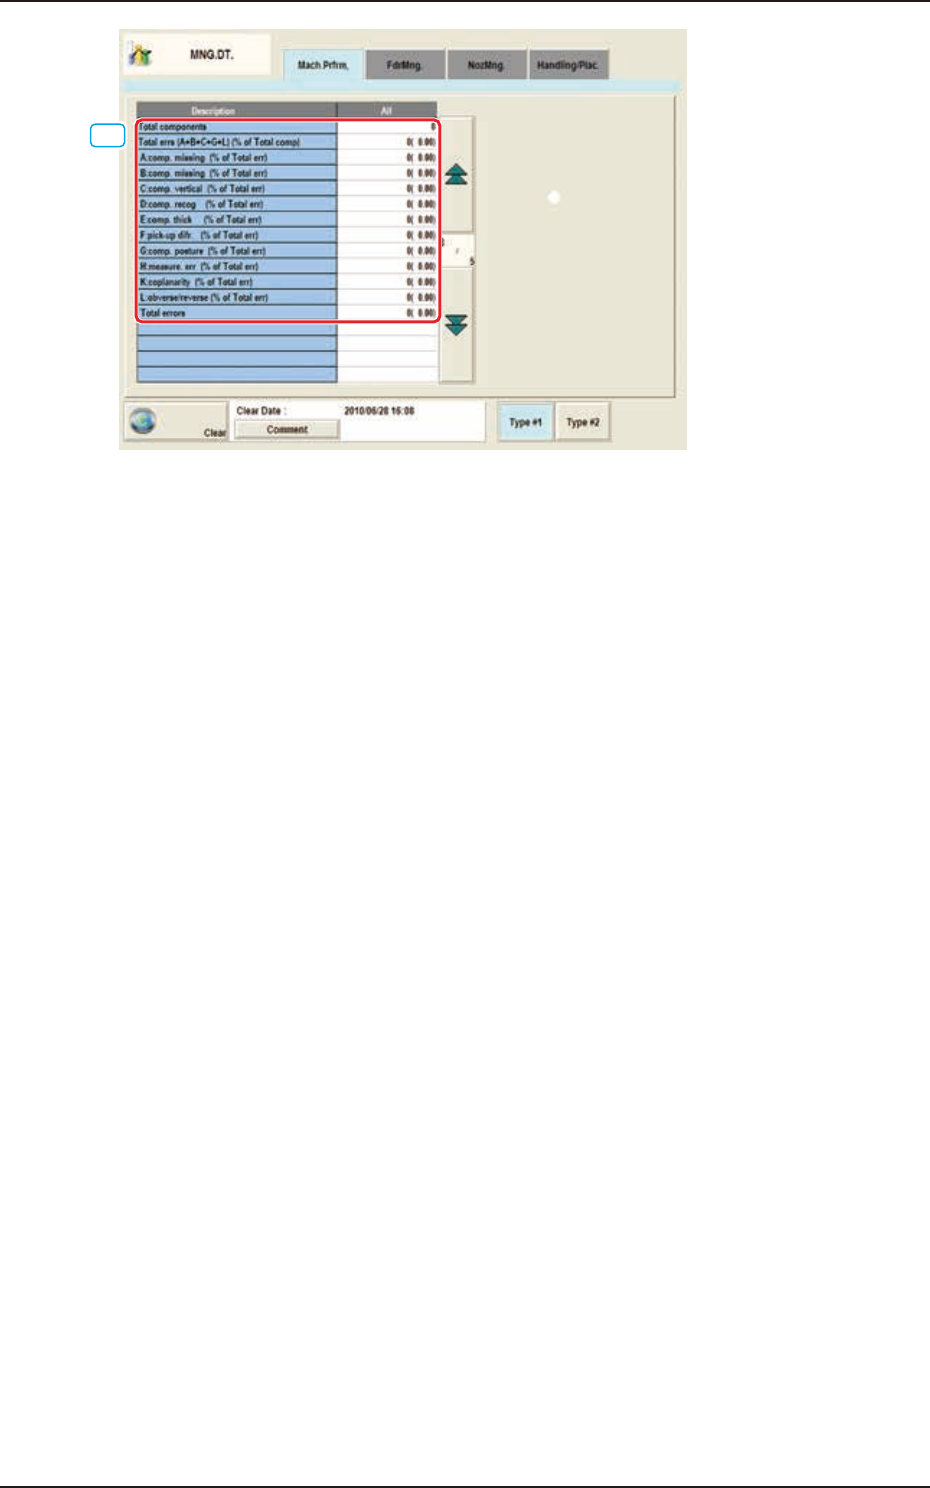
[14] Total components
Number of the pick-up operation times is displayed in this data box.
Total errs (A+B+C+G+L) (% of Total cmp)
Shown are the total number of pickup errors, the total number of components to be picked
up, and the percentage of picked components per total number of pickup errors.
A:comp.missing (% of Total err)
Shown are the number of component missing errors detected by the linear measure detection
sensor and the percentage of component missing errors per total number of pickup errors.
B:comp. missing (% of Total err)
Shown are the number of component missing errors detected in the recognition process and
the percentage of component missing errors per total number of pickup errors.
C:comp. vertical (% of Total err)
Shown are the number of vertical component errors detected by the linear measure detection
sensor and the percentage of vertical component errors per total number of pickup errors.
D:comp. recog (% of Total err)
Shown are the number of errors detected in the recognition process and the percentage of
errors per total number of pickup errors.
E:comp. thick (% of Total err)
Shown is the percentage of component thickness errors detected by the linear measure
detection sensor per total number of pickup errors.
F:pick-up difr. (% of Total err)
Shown are the number of pickup difference errors detected in the recognition process and
the percentage of the errors per total number of pickup errors.
G:comp. posture (% of Total err)
Shown are the number of reversed component and polarity judgment errors detected in the
recognition process and the percentage of the errors per total number of pickup errors.
H:measure. err (% of Total err)
The measurement value error count and percentage to the total error count are displayed in
this data box.
K:coplanarity (% of Total err)
The percentage of error detected in the optional device installation, is displayed in this data box.
L:obverse / reverse (% of Total err)
The percentage of the error times in the front/rear judgment using the linear measure to the
pick-up error total times, is displayed in this data box.
Total errors
Shown is the total number of component handling errors.