EUKYX-199-2100_G5S2_Instruction_Vol2_E.pdf - 第216页
EUKYX 4-24 199-2100 3.3 "EdrMng." T ab Sheet 3.3 "EdrMng. " T ab She et [1] [2] [3] [4] [6] [7] [8] [5] [9] [10] [11] [12] [13] [14] [15] [16] [19] [20] [21] [22] [17] [18] F2D20

EUKYX
4-23199-2100
3.2 "Mach.Prfrm," Tab Sheet
[17] Lcl fid.err (% of Total PEC recog. err)
Shown are the total number of recognition errors in each unit PCB and the percentage of the
detected errors per total number of all errors detected by the PEC recognition function.
[18] Total PEC recognition errors
Shown is the total number of errors detected by the PEC recognition function.
The number of errors detected by the global PEC recognition function and the total number
of errors detected by the BBR recognition function are displayed.
[19] CPH (PCB transfer time included)
The placeable component quantity per hour including PCB transfer time.
Latest value:
The placeable component quantity per hour when the program pattern is produced at the
end.
Average value:
The placeable component average quantity per hour when the program pattern is being
produced.
Max value:
The placeable component maximum quantity per hour when the program pattern is being
produced.
CPH (Only placement time)
The placeable component quantity per hour excluding PCB transfer time.
EUKYX
4-24199-2100
3.3 "EdrMng." Tab Sheet
3.3 "EdrMng." Tab Sheet
[1]
[2]
[3] [4] [6]
[7] [8]
[5]
[9] [10] [11] [12] [13]
[14] [15] [16]
[19] [20] [21]
[22]
[17] [18]
F2D20

EUKYX
4-25199-2100
3.3 "EdrMng." Tab Sheet
(a) The displayed tab sheet will look different, depending on which option is selected.
(b) Each item box functions as a button and each pressing of the buttons can list the data
parameters in descending order. The top box shows the largest value for error times.
Therefore, it is useful for the analysis to enhance the operation rate. When the [Feeder
No.] button is pressed, the Nos. are re-arranged in their initial order (Feeder Nos.).
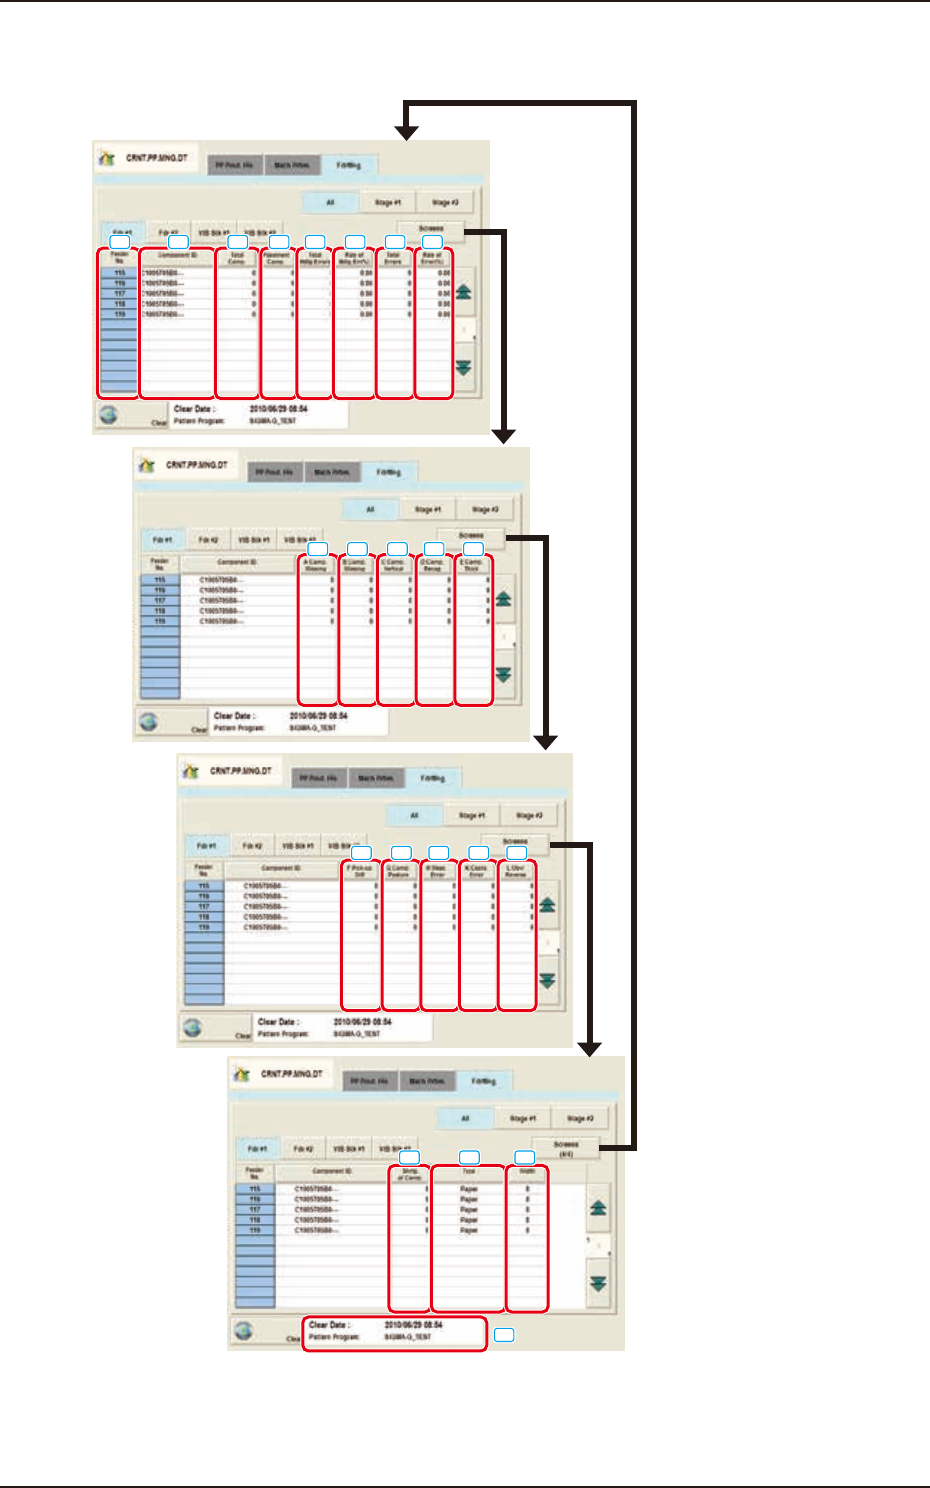
The "EdrMng." tab sheet is divided further into several tabs and each tab sheet shows the handling
errors per feeder on each individual feeder bases.
When each tab is pressed, the corresponding tab sheet appears.
[1] Feeder No.
Shown are the feeder Nos.
[2] Component ID.
The set component ID is displayed in this data box.
[3] Total Comp
Each text box shows the total number of picked components (number of pickup actions) for each
individual feeders.
[4] Placement Comp.
The number of component placement operation total times for each feeder, is displayed in these
data box.
[5] Total Hdlg Errors
The number of pick-up error total times for each feeder is displayed in these data box.
[6] Rate of Hdlg Err (%)
The percentage of the pick-up error total times to the total pick-up operation times, is displayed in
this data box.
[7] Total Errors
Each text box shows the total number of errors detected in [5] through [13].
[8] Rate of Error [%]
Each text box shows the percentage of the total number of errors per the number of picked
components.
[9] A:Comp. Missing
Each text box shows the total number of missing components detected by the linear measure
detection sensor for each individual feeders.
[10] B:Comp. Missing
Each text box shows the total number of missing components detected through recognition
operation for each individual feeders.
[11] C:Comp. Vertical
Each text box shows the total number of vertical component errors detected by the linear measure
detection sensor for each individual feeders.
[12] D:Comp. Recog.
Each text box shows the total number of errors detected through recognition operation for each
individual feeders.
[13] E:Comp. Thick
Each text box shows the total number of errors in component thickness detected by the linear
measure detection sensor for each individual feeders.
Note