3OM-1050-002.pdf - 第193页
3 . 3 "Sub-System Error Counts" T ab The corresponding tab sheet enables the operator to view the total num- ber of errors that occurred on each device during automatic operation. • Sheet Layout When the "…

3point errors (% of Total P.E.C. recog. errors)
Shown are the total number of errors detected on the third fiducial
mark and the percentage of the detected errors per total number
of all errors detected by the P.E.C. recognition function.
Local fiducial errors (% of Total P.E.C. recog. errors)
Shown are the total number of individual P.E.C. recognition errors
and the percentage of the detected errors per total number of all
errors detected by the P.E.C. recognition function.
Total P.E.C. recognition errors
Shown is the total number of errors detected by the P.E.C. recog-
nition function.
The number of errors detected by the global P.E.C. recognition
function and the total number of errors detected by the B.B.R.
recognition function are displayed.
*2 Vertical Scroll Bar
Scroll arrows are located at both ends of a scroll bar. The up or the
down arrow can be pressed to scroll up or down a tab sheet to
expose hidden items.
3.2 "Machine Performance Data" Tab
0210-001 4-17-1 AFO01EDTP
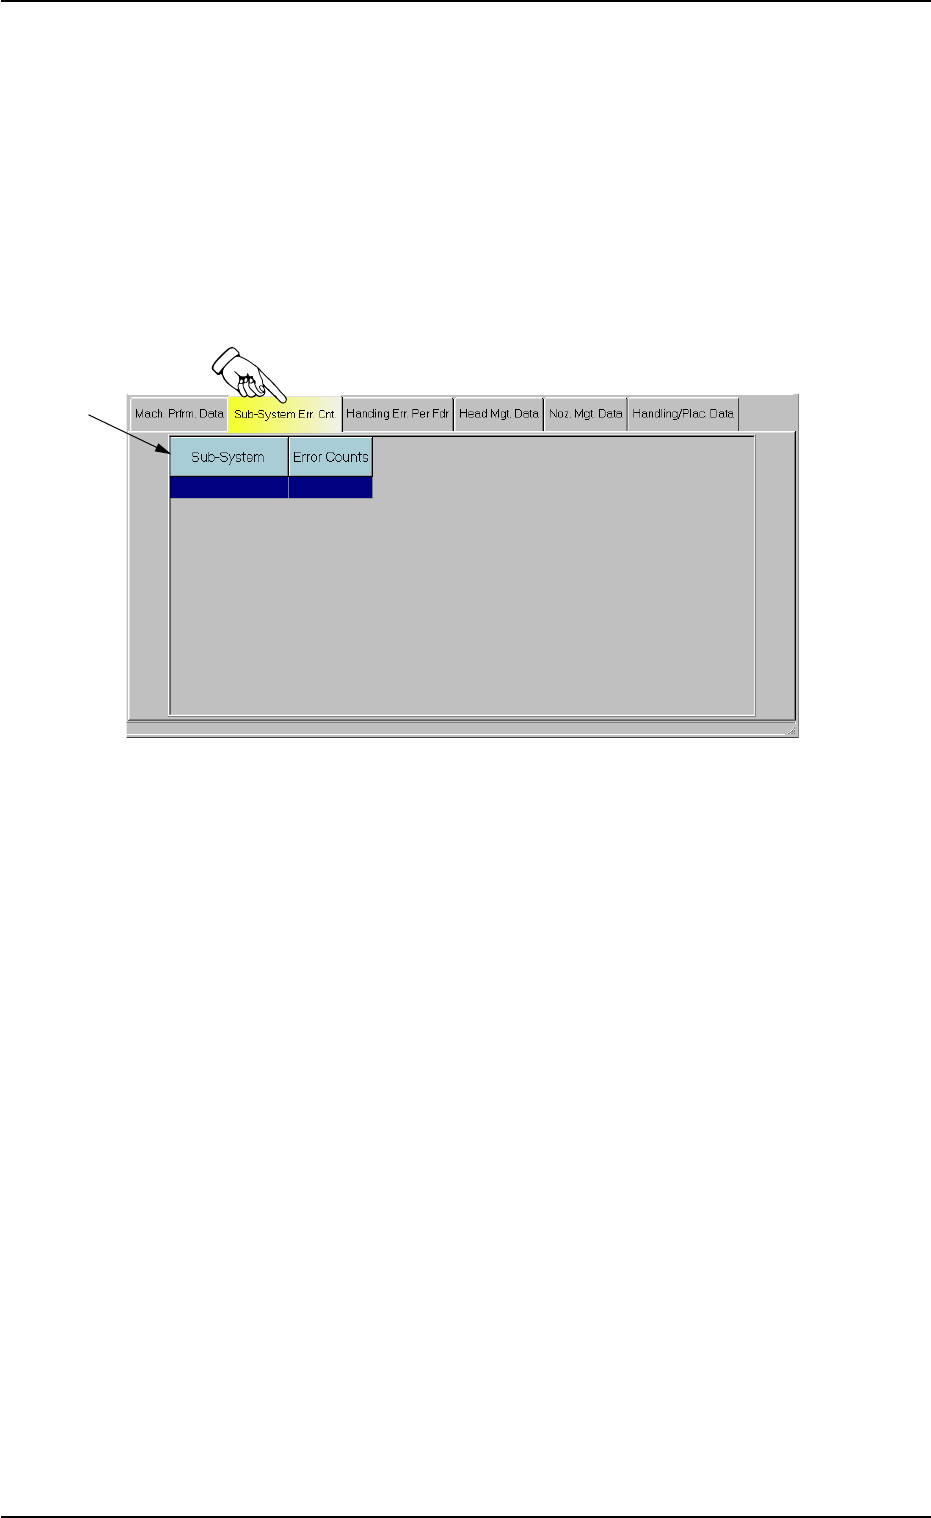
3.3 "Sub-System Error Counts" Tab
The corresponding tab sheet enables the operator to view the total num-
ber of errors that occurred on each device during automatic operation.
• Sheet Layout
When the "Sub-System Error Counts" tab is pressed in the "Manage-
ment Data" window, the following tab sheet appears inside the window.
Fig. 3D10 "Sub-System Error Counts" Tab Sheet
• Sheet Composition
*1 Items
The following items are displayed.
(1) Sub-System
Shown is the device on which an error occurred.
(2) Error Counts
Shown is the total number of errors that occurred on the device.
• How to view the details
When the device line is pressed to view the details, the "Details" win-
dow opens.
The "Details" window displays the number of errors that have oc-
curred in each error-caused spot of the selected device.
When the [OK] button is pressed in the "Details" window, the "De-
tails" window closes.
01 10-003 4-18
AFO01EDTP
*1
3.3 "Sub-System Error Counts" Tab
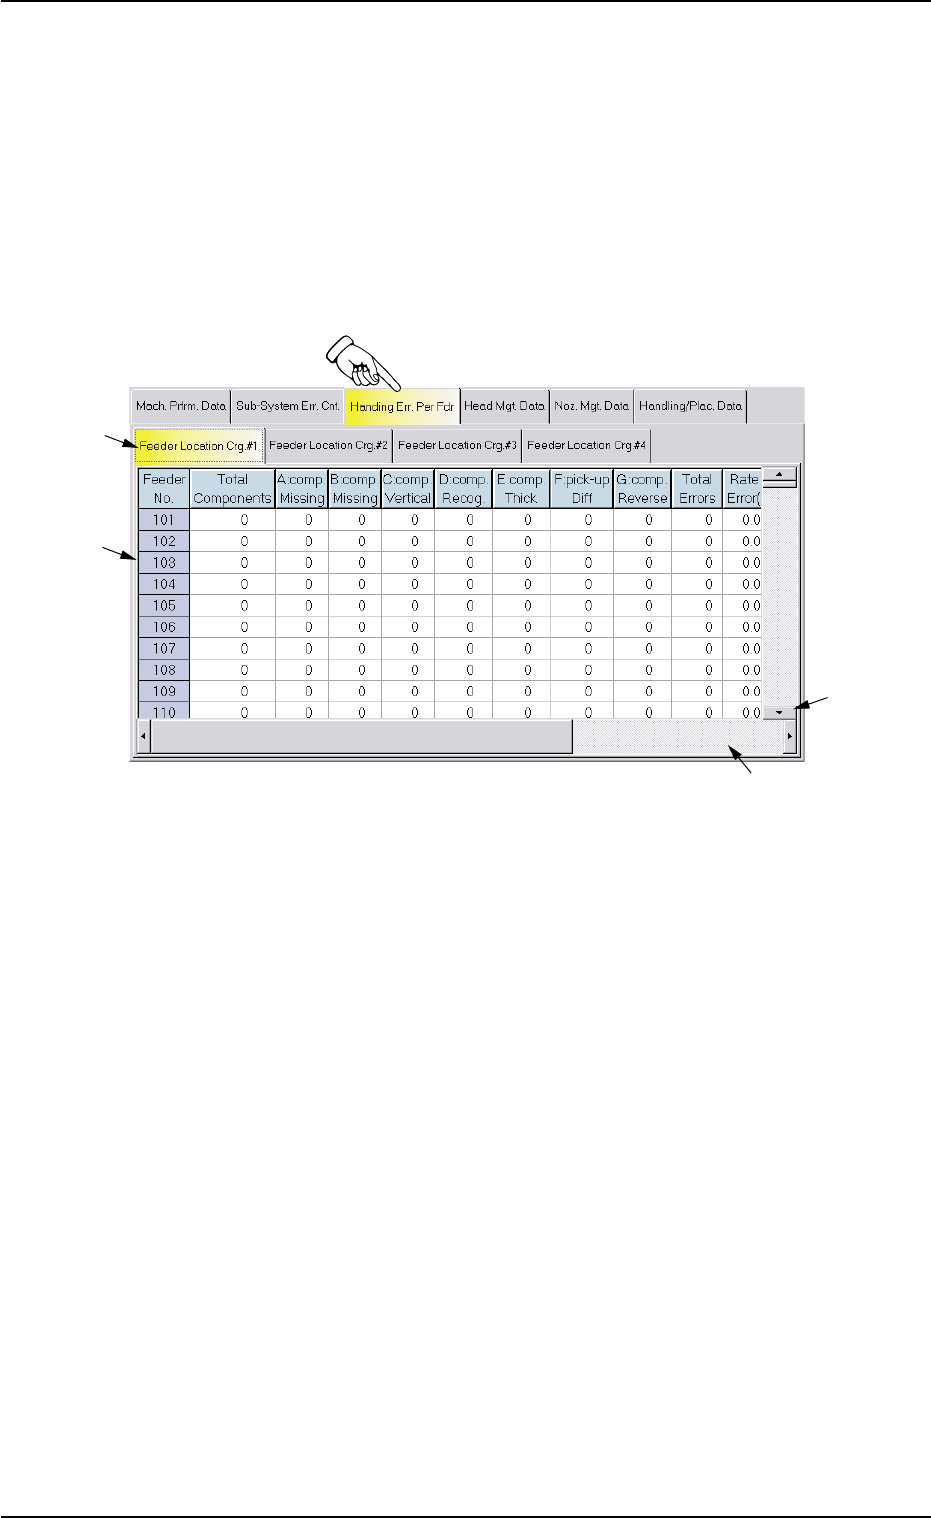
3.4 "Handling Errors Per Feeder" Tab
The corresponding tab sheet enables the operator to view the handling
errors on each individual feeders.
• Sheet Layout
When the "Handling Errors Per Feeder" tab is pressed in the "Manage-
ment Data" window, the following tab sheet appears inside the window.
Fig. 3D11 "Handling Errors Per Feeder" Tab Sheet
• Sheet Composition
*1 "Feeder Location Crg. #1 through #4" Tabs
The "Handling Errors Per Feeder" tab sheet is divided further into
four tab sheets and each tab sheet shows the handling errors per
feeder on each individual feeder carriages.
When a tab is pressed, the corresponding tab sheet appears, indi-
cating that the related feeder carriage is selected.
*2 Items
The following items are displayed.
(1) [Feeder No.] Button
Shown are the feeder Nos.
(2) [Total Components] Button
Each text box shows the total number of picked components (num-
ber of pick-up actions) for each individual feeders.
3.4 "Handling Errors Per Feeder" Tab
0307-005 4-19 AFO01EDTP
*1
*3
*4
*2