3OM-1050-002.pdf - 第215页
(15) Width (mm) Shown are the component widths. When one of the above buttons is pressed, the feeder No. with the biggest parameter under the selected button is displayed in the first line and feeder Nos. having the subs…

(4) [B: comp. Missing] Button
Each text box shows the total number of missing components
detected through recognition operation for each individual feed-
ers.
(5) [C: comp. Vertical] Button
Each text box shows the total number of vertical components
detected by the linear measure detection sensor for each indi-
vidual feeders.
(6) [D: comp. Recog.] Button
Each text box shows the total number of errors detected through
recognition operation for each individual feeders.
(7) [E: comp. Thick] Button
Each text box shows the total number of errors in component
thickness detected by the linear measure detection sensor for
each individual feeders.
(8) [F: pick-up Diff] Button
Each text box shows the total number of pick-up difference er-
rors detected through recognition operation for each individual
feeders.
(9) [G: Comp. Reverse] Button
Each text box shows the total number of reversed component
errors detected through recognition operation for each individual
feeders.
(10) [Total Errors] Button
Each text box shows the total number of errors detected in (3)
through (9).
(11) [Rate of Error (%)] Button
Each text box shows the percentage of the total number of er-
rors per the number of picked components.
(12) [Shrtg. of Comp.] Button
Each text box shows the total number of component shortage
errors detected for each individual feeders.
(13) Component ID.
Shown are the component IDs for each individual feeders.
(14) Type
Shown are the packaging types of the related component IDs.
4.3 "Handling Errors Per Feeder" Tab
0210-004 4-38 AFO01EDTP

(15) Width (mm)
Shown are the component widths.
When one of the above buttons is pressed, the feeder No. with
the biggest parameter under the selected button is displayed in
the first line and feeder Nos. having the subsequent (second,
third, fourth, ...) biggest parameters follow. That is, parameters
are re-arranged in order of error counts (from the biggest to the
smallest ones), making it easy to analyze and improve produc-
tion rate.
When the [Feeder No.] button is pressed, feeder Nos. are ar-
ranged in their initial order (order of slot Nos.).
*3 Vertical Scroll Bar
Up and down arrows are located at both ends of a scroll bar. The up
or the down arrow can be pressed to scroll up or down a tab sheet
to expose hidden parameters (data for the hidden feeder Nos.).
*4 Horizontal Scroll Bar
Right and left arrows are located at both ends of a scroll bar. The
right or the left arrow can be pressed to scroll right or left a tab sheet
to expose hidden parameters.
4.3 "Handling Errors Per Feeder" Tab
0307-005 4-39 AFO01EDTP
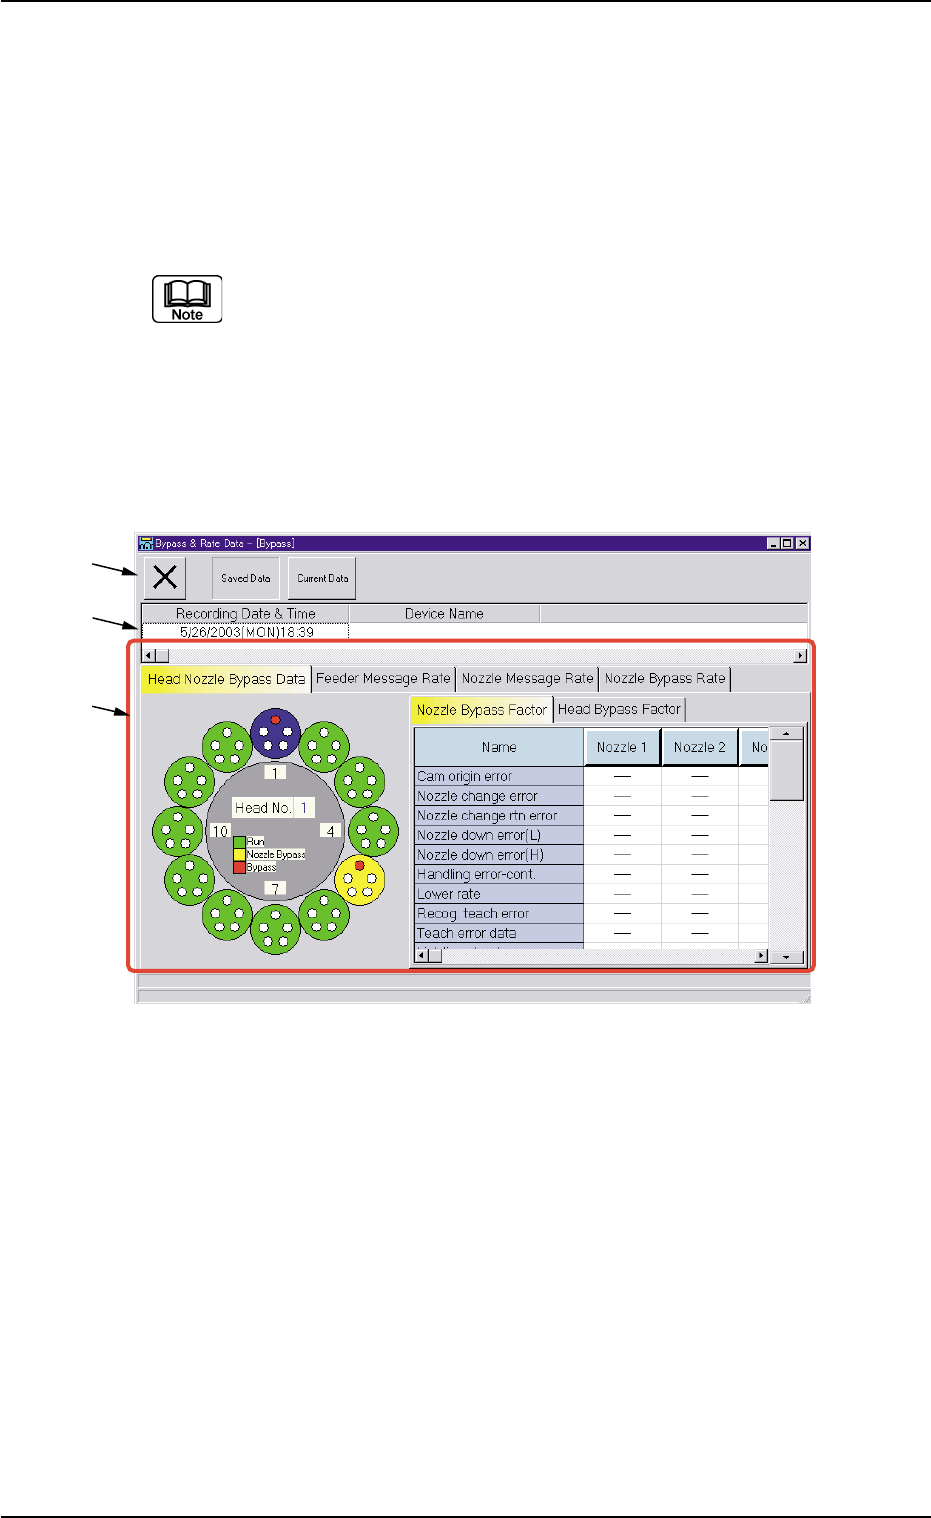
5. "Bypass & Rate Data" Window
This window enables the operator to check the pick-up rate and nozzle
bypass condition (managed for each individual feeders or nozzles) based
on each pick-up rate and nozzle bypassing specified in the auto opera-
tion setup.
Refer to "3.3.1 "Auto Operation Setup" Tab" in "Section 5" for
the parameter settings of "Auto Operation".
• Window Layout
When the [Comp. Handling Err. Rate Dt.] button in the "Comp. Han-
dling Err. Rate Dt." tab sheet ("Management Data" window) is pressed,
the "Bypass & Rate Data" window opens.
Fig. 3D19 "Bypass & Rate Data" Window
• Window Composition
*1 Toolbar
The following buttons are provided on this bar.
[Close] Button
When this button is pressed, the "Bypass & Rate Data" window
closes.
[Saved Data] Button
When pressed, this button displays the data saved as bypass &
rate data.
[Current Data] Button
When pressed, this button displays the current bypass & rate data.
*1
*2
*3
0307-006 4-40 AFO01EDTP
5. "Bypass & Rate Data" Window