3OM-1050-002.pdf - 第213页
4 . 3 "Handling Errors Per Feeder" T ab The corresponding tab sheet enables the operator to view the handling errors on each individual feeders. • Sheet Layout When the "Handling Errors Per Feeder" ta…

3point errors (% of Total P.E.C. recog. errors)
Shown are the total number of errors detected o the third fiducial
mark and the percentage of the detected errors per total num-
ber of all errors detected by the P.E.C. recognition function.
Local fiducial errors (% of Total P.E.C. recog. errors)
Shown are the total number of individual P.E.C. recognition er-
rors and the percentage of the detected errors per total number
of all errors detected by the P.E.C. recognition function.
Total P.E.C. recognition errors
Shown is the total number of errors detected by the P.E.C. rec-
ognition function.
The number of errors detected by the global P.E.C. recognition
function and the total number of errors detected by the B.B.R.
recognition function are displayed.
*2 Vertical Scroll Bar
Scroll arrows are located at both ends of a scroll bar. The up or the
down arrow can be pressed to scroll up or down a tab sheet to
expose hidden items.
4.2 "Machine Performance Data" Tab
0210-001 4-36-1 AFO01EDTP
4.3 "Handling Errors Per Feeder" Tab
The corresponding tab sheet enables the operator to view the handling
errors on each individual feeders.
• Sheet Layout
When the "Handling Errors Per Feeder" tab is pressed in the "Pattern
Program Management Data" window, the following tab sheet appears
inside the window.
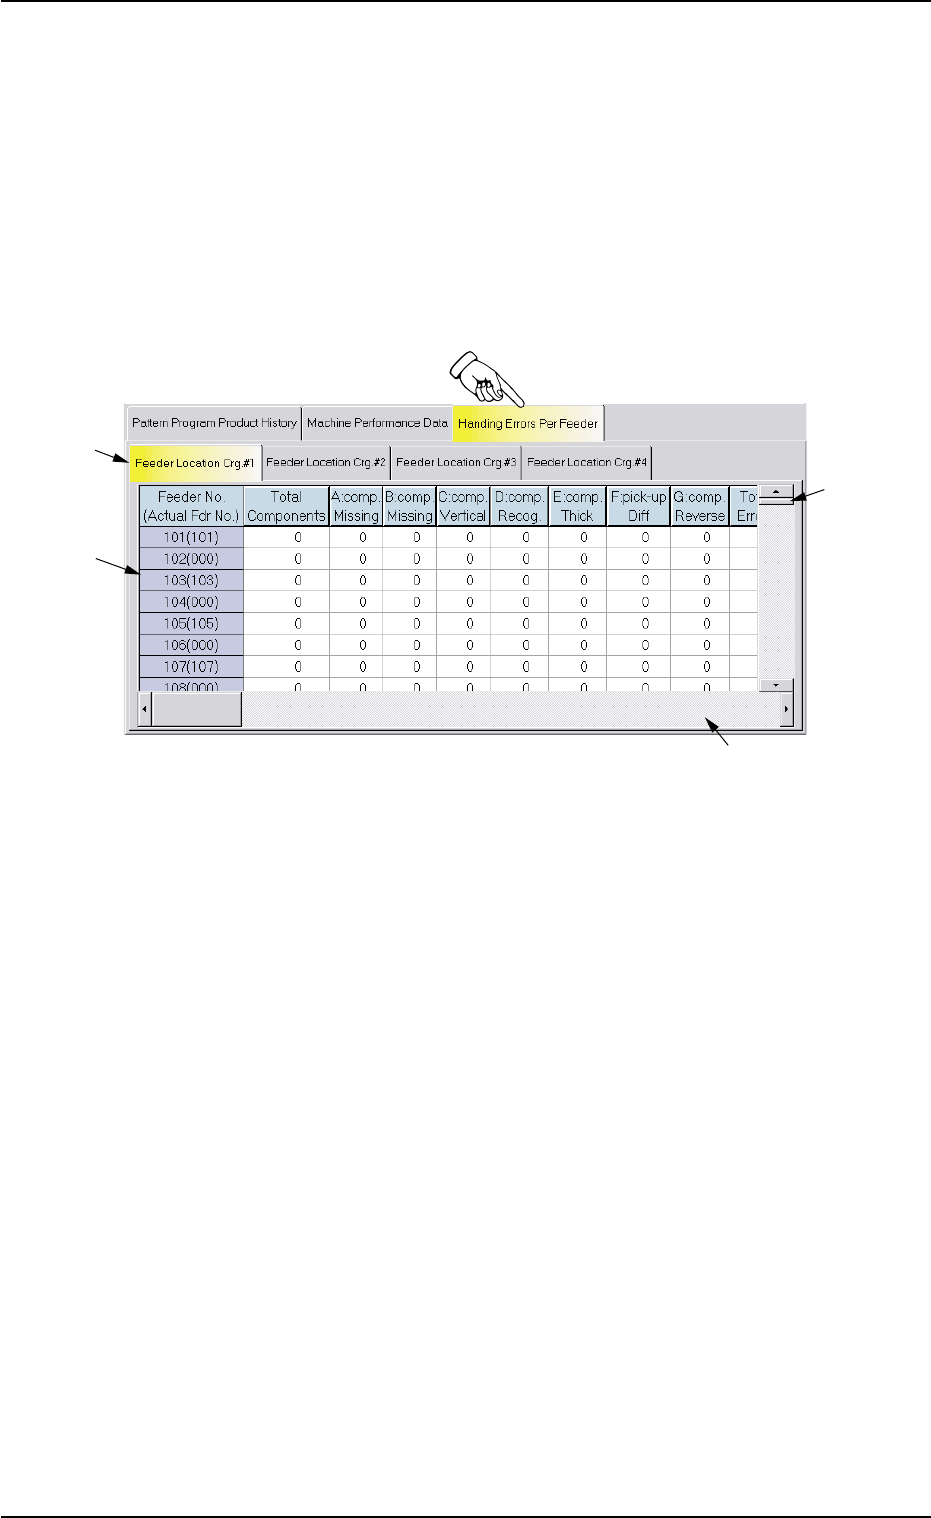
Fig. 3D18 "Handling Errors Per Feeder" Tab Sheet
• Sheet Composition
*1 "Feeder Location Crg. #1 through #4" Tabs
The "Handling Errors Per Feeder" tab sheet is divided further into
four tab sheets and each tab sheet shows the handling errors per
feeder on each individual feeder carriages.
When a tab is pressed, the corresponding tab sheet appears, indi-
cating that the related feeder carriage is selected.
*2 Items
The following items are displayed.
(1) [Feeder No. (Actual Fdr No.)] Button
Shown are the feeder Nos.
(2) [Total Components] Button
Each text box shows the total number of picked components
(number of pick-up actions) for each individual feeders.
(3) [A: comp. Missing] Button
Each text box shows the total number of missing components
detected by the linear measure detection sensor for each indi-
vidual feeders.
*1
*3
*2
*4
0307-006 4-37 AFO01EDTP
4.3 "Handling Errors Per Feeder" Tab

(4) [B: comp. Missing] Button
Each text box shows the total number of missing components
detected through recognition operation for each individual feed-
ers.
(5) [C: comp. Vertical] Button
Each text box shows the total number of vertical components
detected by the linear measure detection sensor for each indi-
vidual feeders.
(6) [D: comp. Recog.] Button
Each text box shows the total number of errors detected through
recognition operation for each individual feeders.
(7) [E: comp. Thick] Button
Each text box shows the total number of errors in component
thickness detected by the linear measure detection sensor for
each individual feeders.
(8) [F: pick-up Diff] Button
Each text box shows the total number of pick-up difference er-
rors detected through recognition operation for each individual
feeders.
(9) [G: Comp. Reverse] Button
Each text box shows the total number of reversed component
errors detected through recognition operation for each individual
feeders.
(10) [Total Errors] Button
Each text box shows the total number of errors detected in (3)
through (9).
(11) [Rate of Error (%)] Button
Each text box shows the percentage of the total number of er-
rors per the number of picked components.
(12) [Shrtg. of Comp.] Button
Each text box shows the total number of component shortage
errors detected for each individual feeders.
(13) Component ID.
Shown are the component IDs for each individual feeders.
(14) Type
Shown are the packaging types of the related component IDs.
4.3 "Handling Errors Per Feeder" Tab
0210-004 4-38 AFO01EDTP