3OM-1050-002.pdf - 第208页
(3) Passed P .C.B. The number of passed P .C.B.’s is counted when the machine is set in the "P ASS" mode. Counting is implemented when the P .C.B. transfer starts (when the P .C.B. on the X/Y table is transferr…
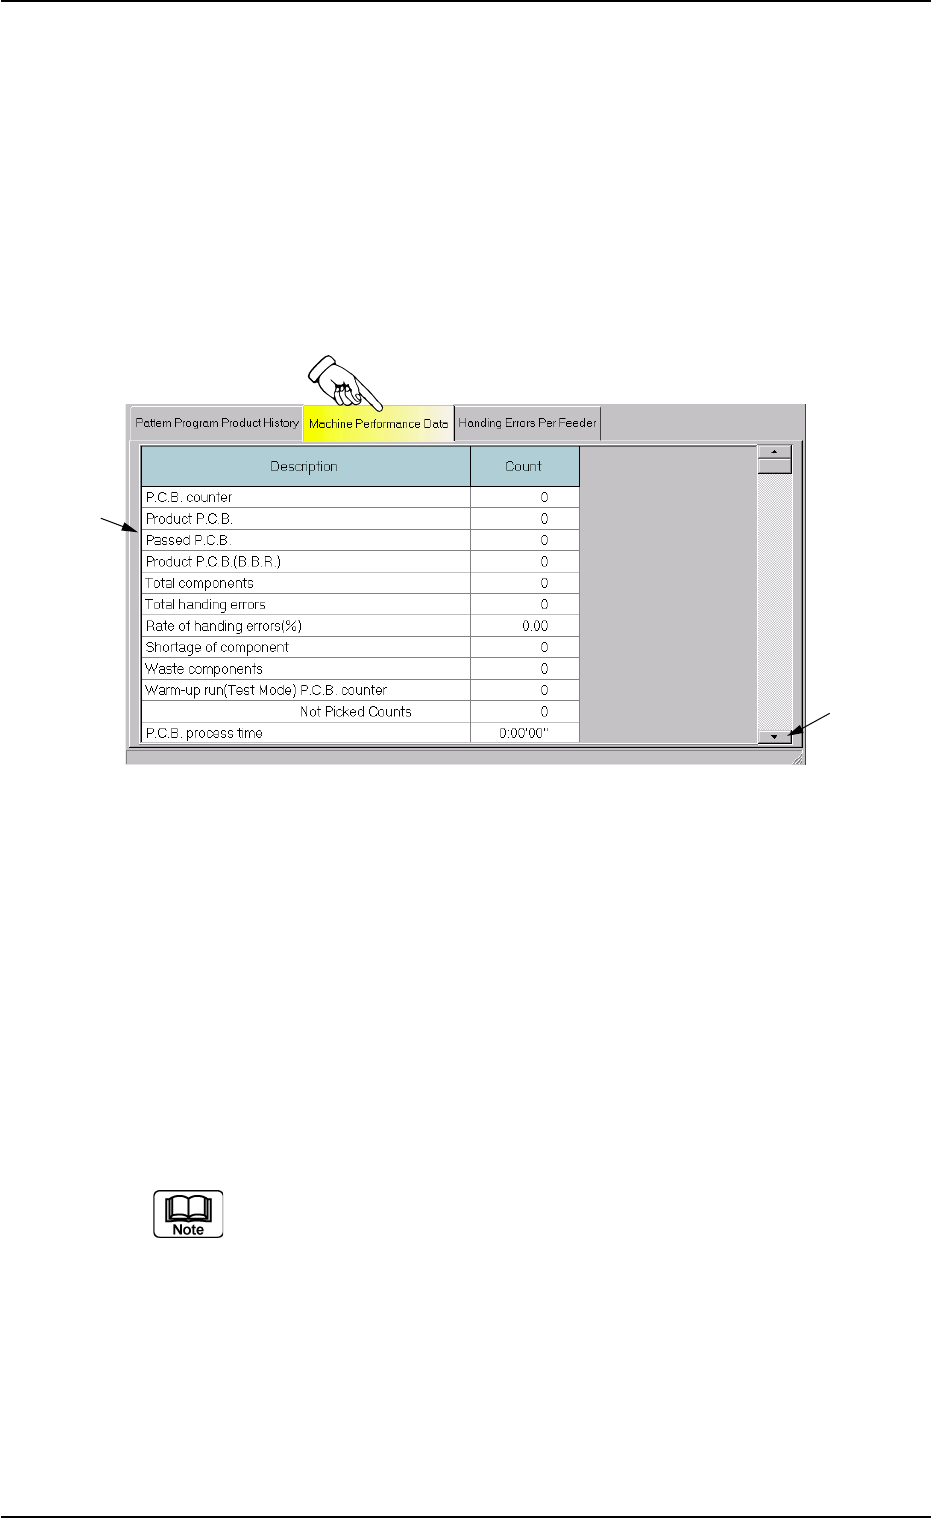
4.2 "Machine Performance Data" Tab
The corresponding tab sheet enables the operator to view the perfor-
mance data of the production model.
• Sheet Layout
When the "Machine Performance Data" tab is pressed in the "Pat-
tern Program Management Data" window, the following tab sheet
appears inside the window.
Fig. 3D17 "Machine Performance Data" Tab Sheet
• Sheet Composition
*1 Items
The following items are displayed.
(1) P.C.B. counter
Shown is the number of produced P.C.B.’s.
Counting is implemented when the X/Y table is zeroed after com-
ponent placement operation (when a P.C.B. is finished).
When a particular pattern program is set several times as cur-
rent one, the sum total is computed.
(2) Product P.C.B.
The number of produced unit P.C.B.’s on multi-unit P.C.B. is
summed up. Counting is implemented when the X/Y table is ze-
roed after component placement operation (when a unit is fin-
ished).
When the bad board reject (B.B.R.) function is used, defective
unit P.C.B.’s are excluded.
4.2 "Machine Performance Data" Tab
*2
*1
0301-005 4-32 AFO01EDTP

(3) Passed P.C.B.
The number of passed P.C.B.’s is counted when the machine is
set in the "PASS" mode.
Counting is implemented when the P.C.B. transfer starts (when
the P.C.B. on the X/Y table is transferred to the output conveyor).
(4) Product P.C.B. (B.B.R.)
Shown is the number of defective P.C.B.’s summed up when
the bad board reject function is used.
(5) Total components
Shown is the number of picked components (the number of pick-
up operations).
(6) Total handling errors
Shown is the total number of component handling errors.
(7) Rate of handling errors (%)
Shown is the percentage of handling errors per total number of
picked components.
(8) Shortage of component
Shown is the total number of detected component shortage er-
rors.
(9) Waste components
Shown is the total number of components that were picked up
but not placed.
(10) Warm-up run (Test Mode)
The data of the warm-up run (dry cycle) is counted.
P.C.B. counter
The number of P.C.B.’s is counted when the machine is oper-
ated under the following condition.
• "ENABLE" set for "TEST RUN" in "Run Mode" Tab Sheet ("OPN.
MODE" Window)
• "PCB XFR Err Det Disabled" Check Box Checked
(State in which no P.C.B. is put in and out)
Not Picked Counts
The number of non-picking/non-placement actions is counted
when the machine is operated under the following condition.
• "ENABLE" set for "TEST RUN" in "Run Mode" Tab Sheet ("OPN.
MODE" Window)
• "Handling/Place Disabled" or "Vacuum/Blower Disabled" Check
Box Checked
0301-005 4-33
AFO01EDTP
4.2 "Machine Performance Data" Tab
(11) P.C.B. process time
Shown is the total of the time required to finish a P.C.B.
(12) Power on time
Shown is the period of time during which the control power of
the machine was kept "ON".
Example: 10:03’50" (10 hours, 3 minutes, and 50 seconds)
Auto run time
Shown is the period of time during which the machine was run-
ning automatically.
When a particular pattern program is set several times as cur-
rent one, the sum total is computed.
Placement Time
Shown is the time required to finish a P.C.B. (from the first to
the last component placement on one product P.C.B.).
The essential component placement time is summed up. While
the machine is set in the "STOP" or the "PAUSE" mode or a
step operation is performed, the time is not measured.
This is used to calculate the average placement tact time per
component.
P.C.B. transfer time
Shown is the period of time during which each motor (motors
to drive the L conveyor, the transfer conveyor, the P.C.B. trans-
fer, and the R conveyor) is being activated.
P.C.B. wait
Input wait
Shown is the period of time during which the machine was
completely in the waiting mode (the machine was waiting for
a P.C.B. to be loaded from the input machine).
Output wait
Shown is the period of time during which the machine was
completely in the waiting mode (the machine was waiting for
a P.C.B. to be unloaded to the output machine).
P.E.C./B.B.R.
Shown is the period of time during which the machine is taking
P.E.C. recognition and B.B.R. detection actions.
Counted is the period of time during which the X/Y table starts
moving and the P.E.C. recognition and B.B.R. detection are
completed.
Others
Shown is the period of time during which the machine takes
actions other than the above-described ones.
Included are the periods of time during which the F-axis takes
actions before component placement, the X/Y table returns af-
ter component placement, etc.
0307-005 4-34
AFO01EDTP
4.2 "Machine Performance Data" Tab