IPC-7095C-2013.pdf - 第109页
the X-ray source, utilizing the peripheral portion of the cone of radiation to produce an oblique view with the high- est achievable magnification. Figures 7-29 and 7-30 illustrate the benefits of oblique viewing at high m…
detecting PCB assembly defects that cause changes in the
solder joint profile. These types of assembly defects
include but are not limited to: solder shorts, solder opens,
insufficient solder joints, missing devices, skewed devices,
and solder voids.
7.3.3.1 Transmission X-Ray Technology In transmis-
sion X-ray, the X-ray source and detector can be fixed or
movable in a variety of motions for variations in magnifi-
cation and angle of view. Generally, all features in the ver-
tical ‘‘line of sight’’ are viewed concurrently without dis-
tinguishing depth.
Differences in material thickness or density will result in
different transmitted X-ray attenuation at the detector
resulting in brighter or darker intensities within the image
display. For a single material type, such as eutectic solder,
the attenuation of the X-ray photons received at the detec-
tor is proportional to the material thickness. A gray scale
image is created which can be interpreted to determine
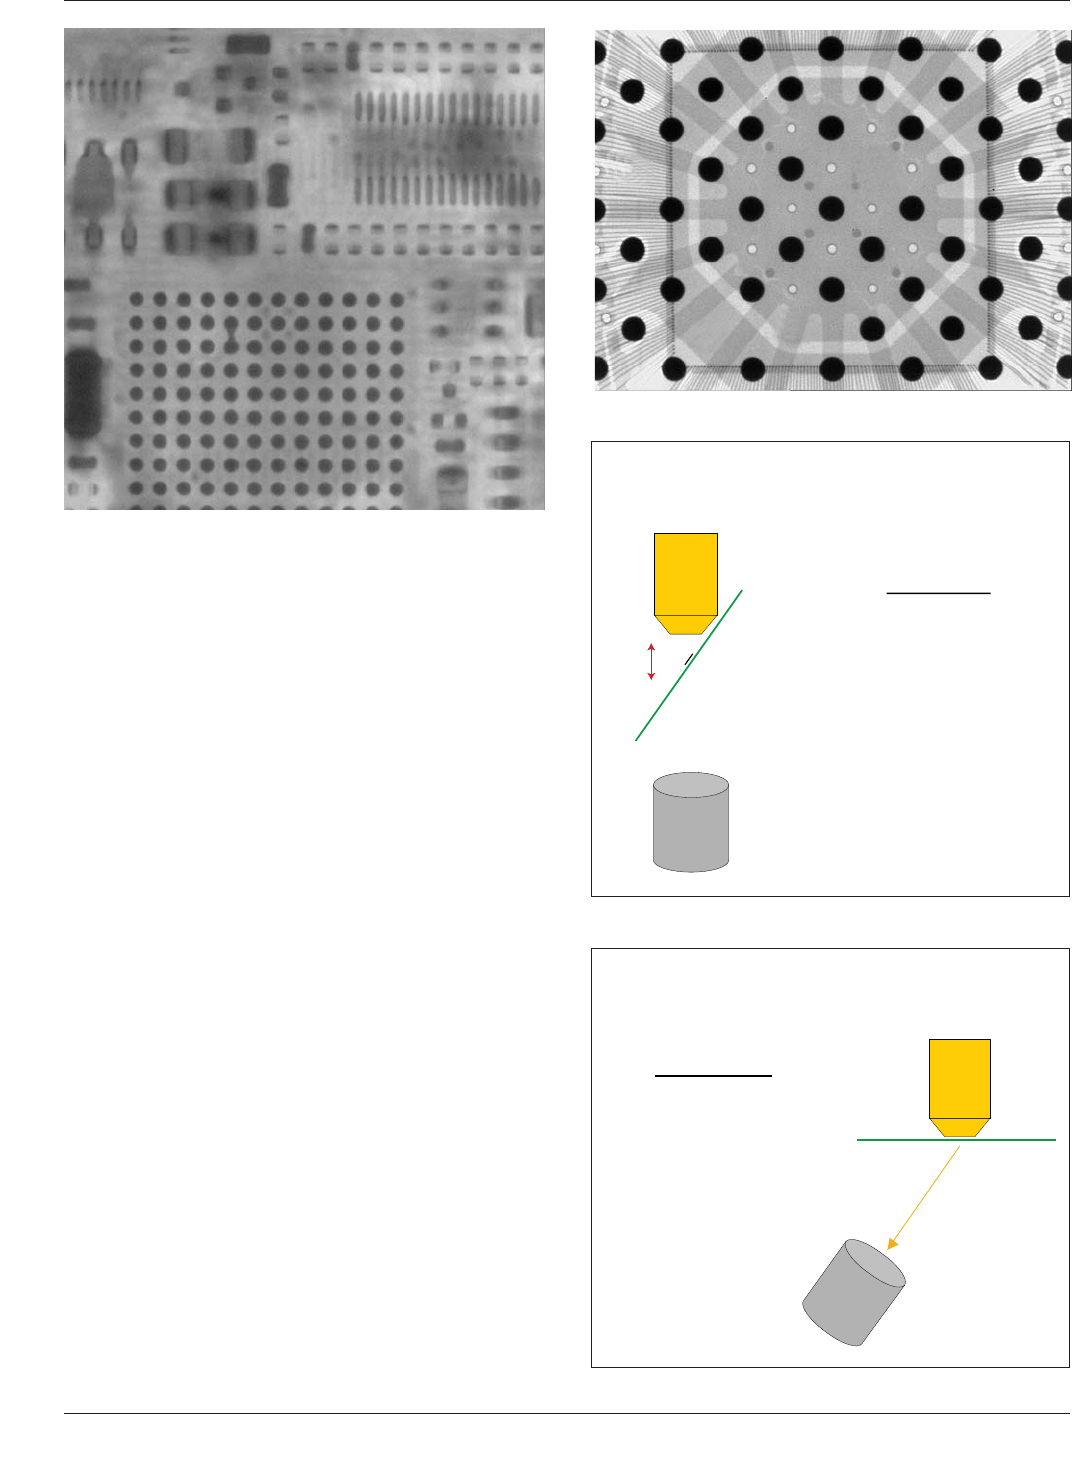
whether or not solder joints are acceptable. Figure 7-26
shows a transmission inspection illustration.
7.3.3.2 Oblique Viewing Inspections with Transmission
X-Ray Technology
There are two basic methods of
oblique viewing of objects with transmission X-ray sys-
tems. One method consists of tilting the sample in order to
get the oblique angle as illustrated in Figure 7-27. Although
this method enables the oblique view, the technique may
not allow for the highest achievable level of magnification
to be realized.
Another method of oblique viewing utilizes a wide angle
transmission X-ray source as illustrated in Figure 7-28. In
this method, the detector rotates around the center axis of
Figure 7-25 Laminographic Cross-Section Image (3D)
Figure 7-26 Transmission Example
IPC-7095c-7-27
Figure 7-27 Oblique Viewing Board Tilt
Oblique Viewing with Board Tilt
Detector
Board with
FBGA
Tilted View
High magnification is
required, but loss of
magnification occurs
through object tilt.
(Due to longer source
to
object distance.)
IPC-7095c-7-28
Figure 7-28 Oblique Viewing Detector Tilt
Oblique View without
Compromising Available Magnification
Detector
Board with
FBGA
Oblique View
High magnification is
required and maintained by
rotating the detector
through the cone of
radiation while keeping it
perpendicular to the center
of the x-ray source.
(Due to shorter source to
object distance.)
IPC-7095C January 2013
94
Copyright IPC-Association Connecting Electronics Industries
Provided by IHS under license with IPC
Not for Resale
No reproduction or networking permitted without license from IHS
--`,,```,,,,````-`-`,,`,,`,`,,`---
the X-ray source, utilizing the peripheral portion of the
cone of radiation to produce an oblique view with the high-
est achievable magnification.
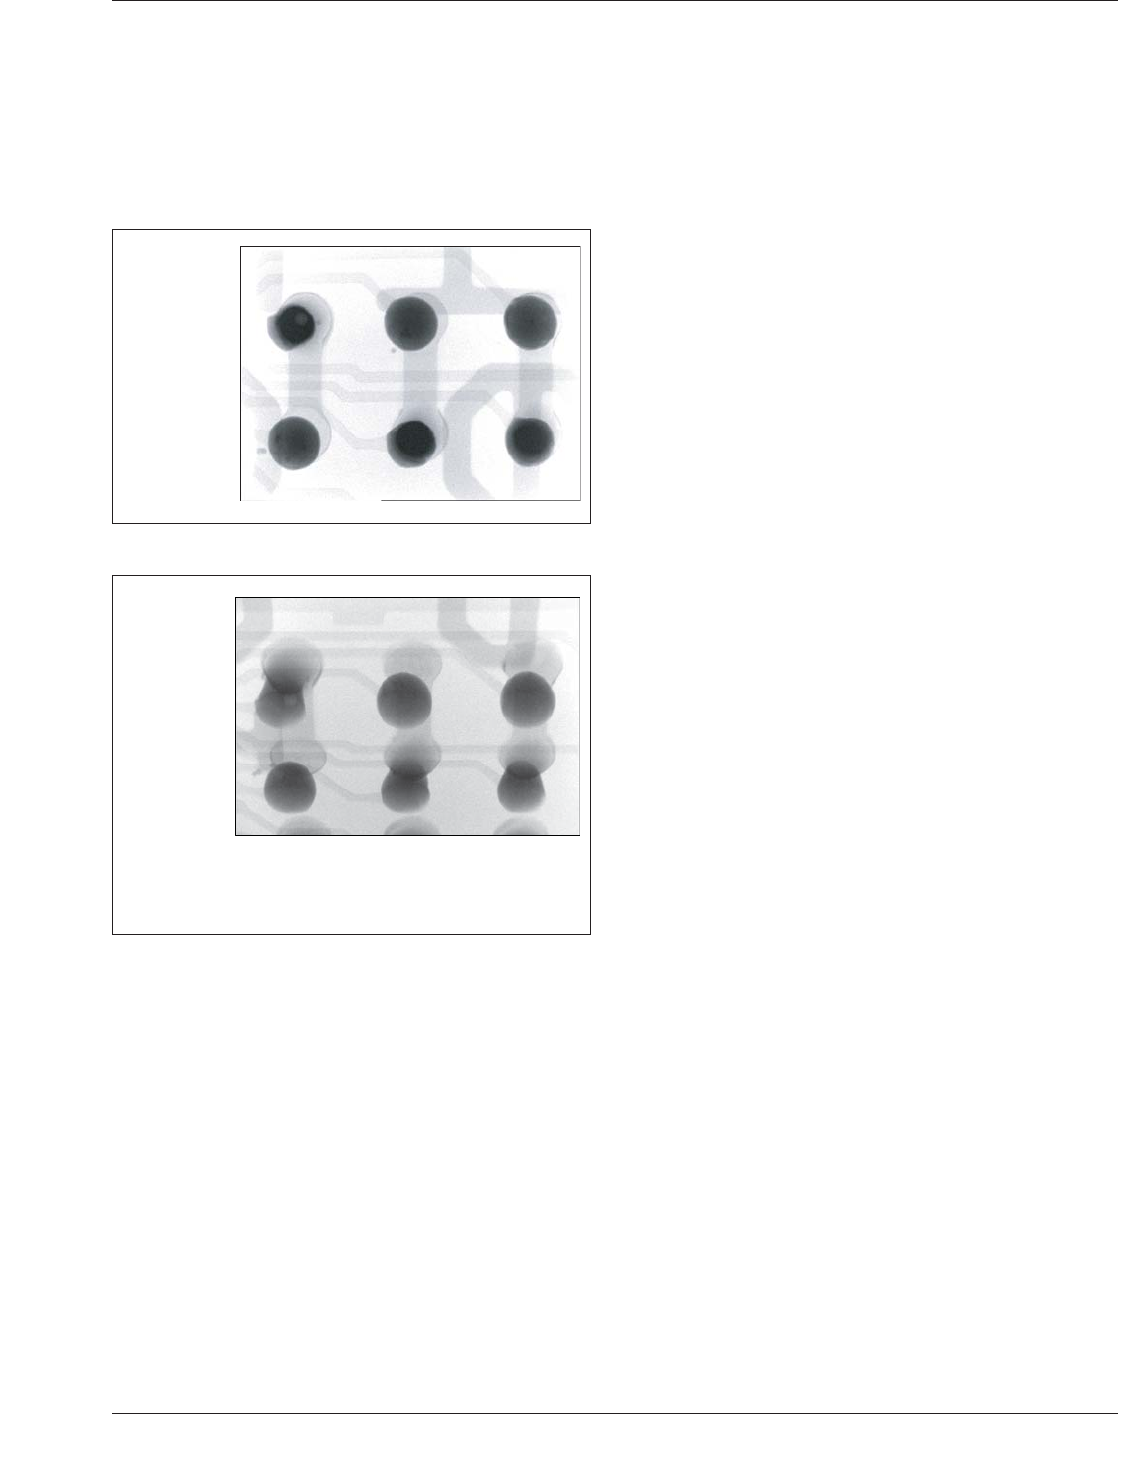
Figures 7-29 and 7-30 illustrate the benefits of oblique
viewing at high magnification with actual images of a
FBGA comparing a top down transmission view with an
oblique view.
The images in Figure 7-29 may be slightly different in tex-
ture and darkness for a lead-free application. The tube
intensity and/or power may need to be slightly reduced in
order to avoid over exposure.
7.3.3.3 Cross-Sectional X-Ray Technologies On double
sided boards, some subset of the solder joints will be inac-
cessible to the transmission X-ray technique due to over-
lap, whereas the cross-section technique will have greater
test access. Because the transmission X-ray technique cap-
tures information from the entire solder volume and the
cross-section technique captures specific slice information,
these techniques have both unique and common capabili-
ties to detect some types of solder defects. For more
detailed information, contact the manufacturers of AXI sys-
tems who can provide information about the capabilities of
their techniques and systems.
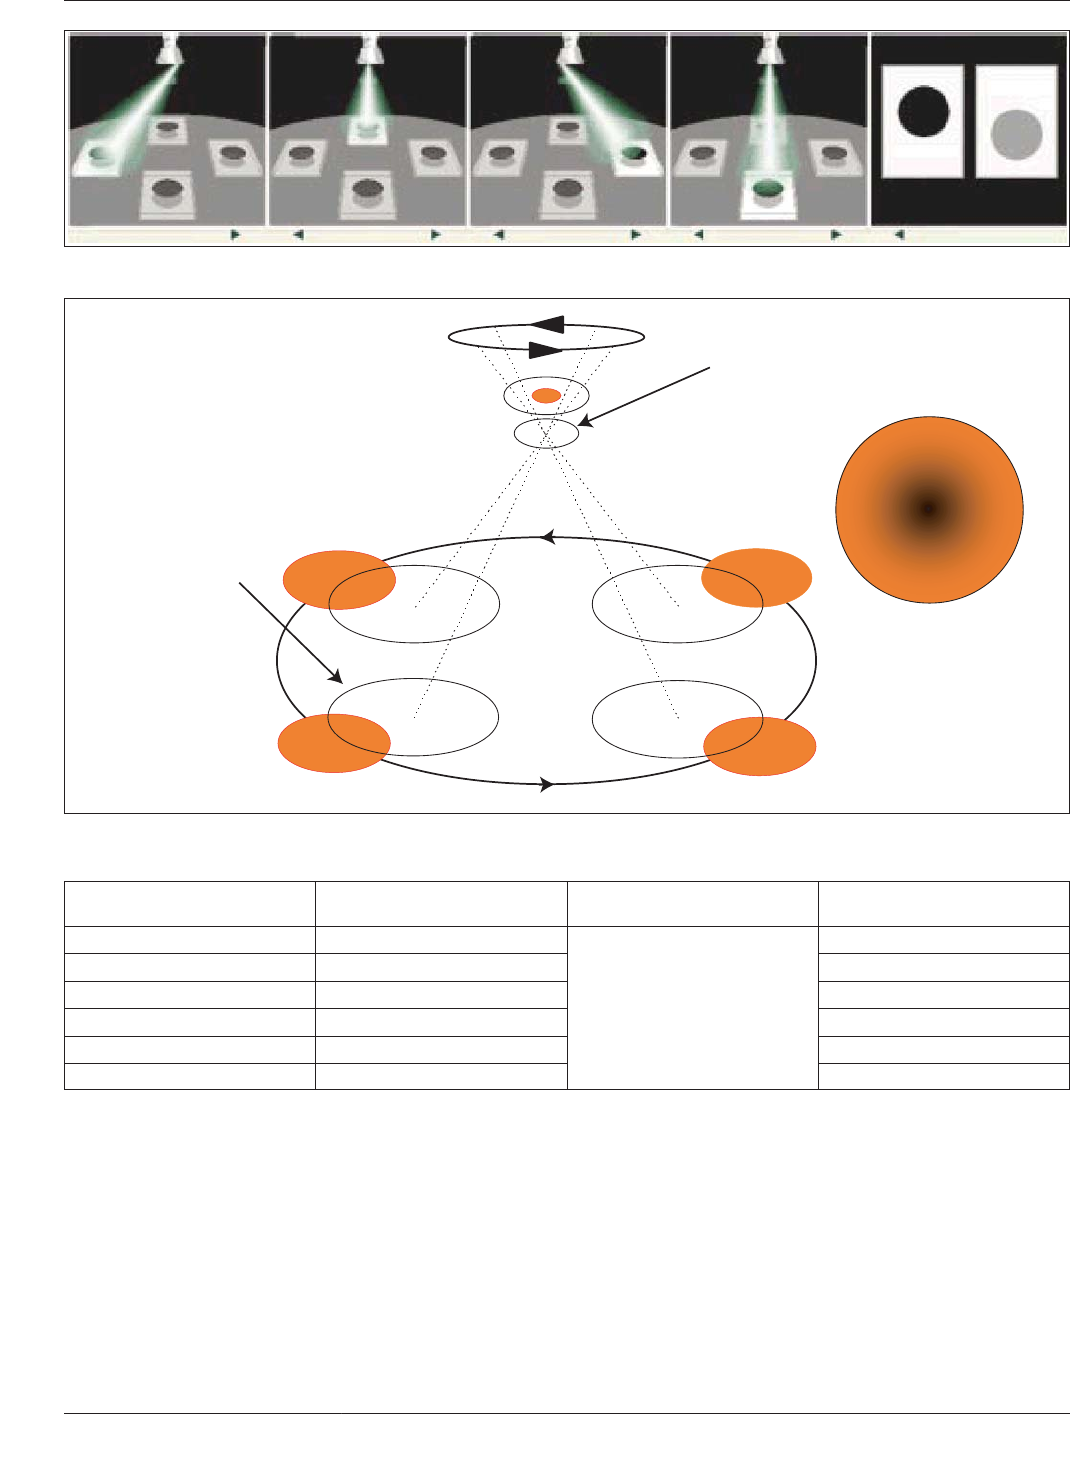
Both tomosynthesis, Figure 7-31, and laminography, Figure
7-32, are radiographic techniques that provide image
‘‘slices’’ of the device that can be viewed. With laminogra-
phy, the X-ray source and the X-ray image plane are
moved in a coordinated way with respect to the electronic
device being inspected. A clear image of only one layer or
slice of the device appears; all other layers in the image
plane are blurred out. Tomosynthesis collects several trans-
mission X-ray images from different angles during the
inspection and combines the digital data of those images
mathematically.
This enables virtual slices to be created at the desired plane
for analysis.
7.3.4 Analysis of the X-Ray Image An understanding of
the construction of the particular BGA device and of the
reflow process will aid in the interpretation and analysis of
the X-ray image of the ball bonds. The concurrent factors
that should be considered for X-ray image analysis might
include:
• Determine if the balls are collapsible (eutectic) or noncol-
lapsible (noneutectic).
• Define if noncollapsible balls have been placed in the
corners to retain coplanarity.
• Was reflow temperature maintained sufficiently to permit
full alignment and collapse?
• Does BGA package appear to have physically deformed
in some way during reflow?
These factors will add further insight into the interpretation
and analysis of the X-ray image.
7.3.4.1 Field of View In determining the criteria for
inspections it is also important to determine how much can
be seen of the BGA at any one time. As the pitch of the
BGA gets smaller, the ball size is also reduced. Several
magnification levels can be applied to the evaluation. Table
7-5 provides the different pitch and ball size characteristics
applicable to any field of view. The magnification range
varies; however, should be between 30X and 50X. Depend-
ing on the ball size, the field of view can be determined by
simply dividing the number 15 by the ball size. Thus, 15
divided by 0.75 (for the 0.75 mm ball) results in being able
to see 20 balls of that size for evaluation. As the ball size
decreases, a greater number of ball images are viewed for
quality evaluations.
The display of the field of view from a real-time x-ray sys-
tem depends on the number of pixels available from the
x-ray detector and how this is displayed on the operator
screen. This can vary from 640 x 480 pixels to 1600 x 1200
pixels, or more, in commercially available x-ray systems.
As one of the quality measurements that is used in this
document is voiding, unless a minimum number of pixels
is suggested for the diameter of the solder balls when under
Figure 7-29 Top Down View of FBGA Solder Joints
FBGA
Solder Joints
Top Down
View
1
2
3
4
5
6
Figure 7-30 Oblique View of FBGA Solder Joints
Three solder joints are clearly open (No. 2,3,4).
The void (No.1) is located near the component pad.
The solder joint above right (No.6) is in contact to the
board but with insufficient wetting (no meniscus).
FBGA
Solder Joints
Oblique View
1
2
3
4
5
6
January 2013 IPC-7095C
95
Copyright IPC-Association Connecting Electronics Industries
Provided by IHS under license with IPC
Not for Resale
No reproduction or networking permitted without license from IHS
--`,,```,,,,````-`-`,,`,,`,`,,`---
inspection, then the precision of any subsequent measure-
ments will be severely compromised. For example, assume
a4x4array of 0.75 mm diameter balls (pitch 1.5 mm) and
a7x7array of 0.30 mm diameter balls (pitch 0.5 mm) are
shown fully on screen (similar to that shown in the table).
On an X-ray system with a 640 x 480 pixel detector
(assuming 1:1 presentation on the display), then for the
shortest screen axis, each type of BGA ball will be 68 and
44 pixels in diameter respectively. With an error of linear
measurement of 2 pixels (one at either edge), for example,
each BGA has an error of 2/68 and 2/44, or 3% and 4.5%
respectively. Should these values then be used to calculate
the area of the balls for the crucial void percentage calcu-
lation, then the error in the area will be 9% and 20%
respectively. In contrast, the values for an x-ray system
with a 1600 x 1200 detector would be 171 and 109 pixels
with a linear error of 1.2% and 1.8% and an area error of
1.5% and 3.25% respectively. For Class 3 products, a
maximum of 4% voiding by area is proposed. In the worst
case above (but as devices continue to shrink then the
lower spec X-ray systems will progressively worsen) the
minimum action level through system measurement will
Figure 7-31 Tomosynthesis
IPC-7095c-7-32
Figure 7-32 Scanned Beam X-Ray Laminography
Rotating X-ray Beam
Rotating X-ray
Detector
A
Result
Focal Plane
AA
A
A
A
Table 7-5 Field of View for Inspection
Nominal Ball Diameter (mm) Pitch (mm)
Magnification
Recommendation Field of View
0.75 1.50, 1.27
30X - 50X
15/0.75 = 20 Balls
0.60 1.00 15/0.60 = 25 Balls
0.50 1.00, 0.80 15/0.50 = 30 Balls
0.45 1.00, 0.80, 0.75 15/0.45 = 34 Balls
0.40 0.80, 0.75, 0.65 15/0.40 = 38 Balls
0.30 0.80, 0.75, 0.65, 0.50 15/0.30 = 50 Balls
IPC-7095C January 2013
96
Copyright IPC-Association Connecting Electronics Industries
Provided by IHS under license with IPC
Not for Resale
No reproduction or networking permitted without license from IHS
--`,,```,,,,````-`-`,,`,,`,`,,`---