TR7500E_Manual_en_v28.pdf - 第120页
C h a p t e r 2 M a nu a l B a r i n t r o d u ce T R 7500 U S E R M A N U AL 1 13 n W r it e T o F i l e – O u t p u t t h e o r i g i n a l d a t a a s t e x t f il e . n OK – C l o s e t h e wi n d o w . 7.9.3. Fo r m…
Chapter 2 Manual Bar introduce
TR7500 USER MANUAL
112
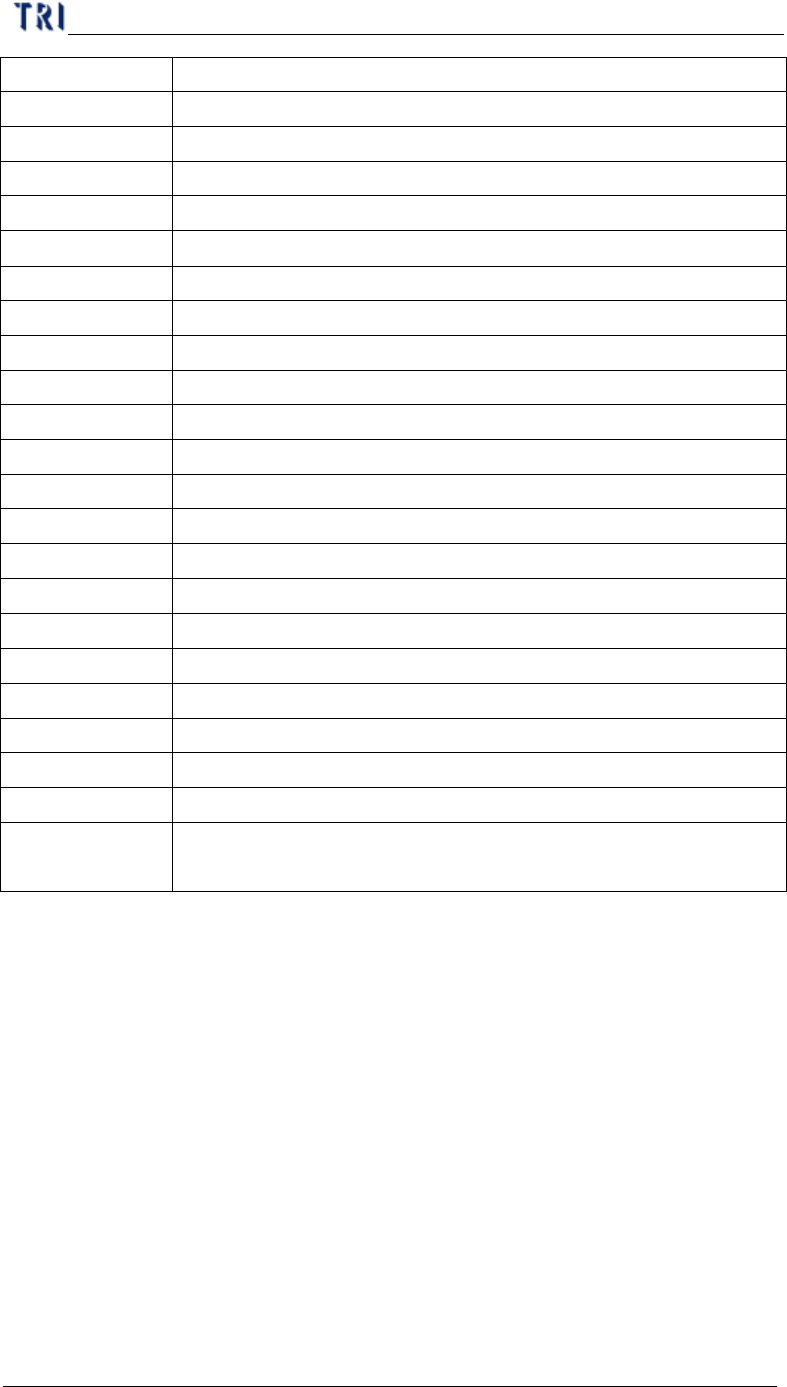
Count The number of data calculated.
X_Max The maximum for X-shift (unit: mm)
Y_Max The maximum for Y-shift (unit: mm)
Theta_Max The maximum for Theta (unit: mm)
X_Min The minimum for X-shift (unit: mm)
Y_Min The minimum for Y-shift (unit: mm)
Theta_Min The minimum for Theta (unit: mm)
X_Average The average for X-shift (unit: mm)
Y_Average The average for Y-shift (unit: mm)
Theta_Average The average for Theta (unit: mm)
X_Sigma The sigma for X-shift (unit: mm)
Y_Sigma The sigma for Y-shift (unit: mm)
Theta_Sigma The sigma for Theta (unit: mm)
X_CpkSpec CpkSpec for X-shift
X_Cpk Cpk for X-shift
Y_CpkSpec CpkSpec for Y-shift
Y_Cpk Cpk for Y-shift
Theta_CpkSpec CpkSpec for Theta
Theta_Cpk Cpk for Theta
Missing The number of missing.
X_Position The result of X coordinate on CAD adds the average of X-shift
Y_Position The result of Y coordinate on CAD adds the average of Y-shift
Status It shows [NG] and displays yellow symbol when there’s a
[Missing] or [Cpk<CpkSpec]. Otherwise it shows [OK].
n Show Graphic – Show the time sequence graph for selected component.
Ø You can select to display the graph of X-shift, Y-shift or Rotation.
Ø The horizontal axis presents the count and the vertical means the
result.
Ø The red line means the average.
Chapter 2 Manual Bar introduce
TR7500 USER MANUAL
113
n Write To File – Output the original data as text file.
n OK – Close the window.
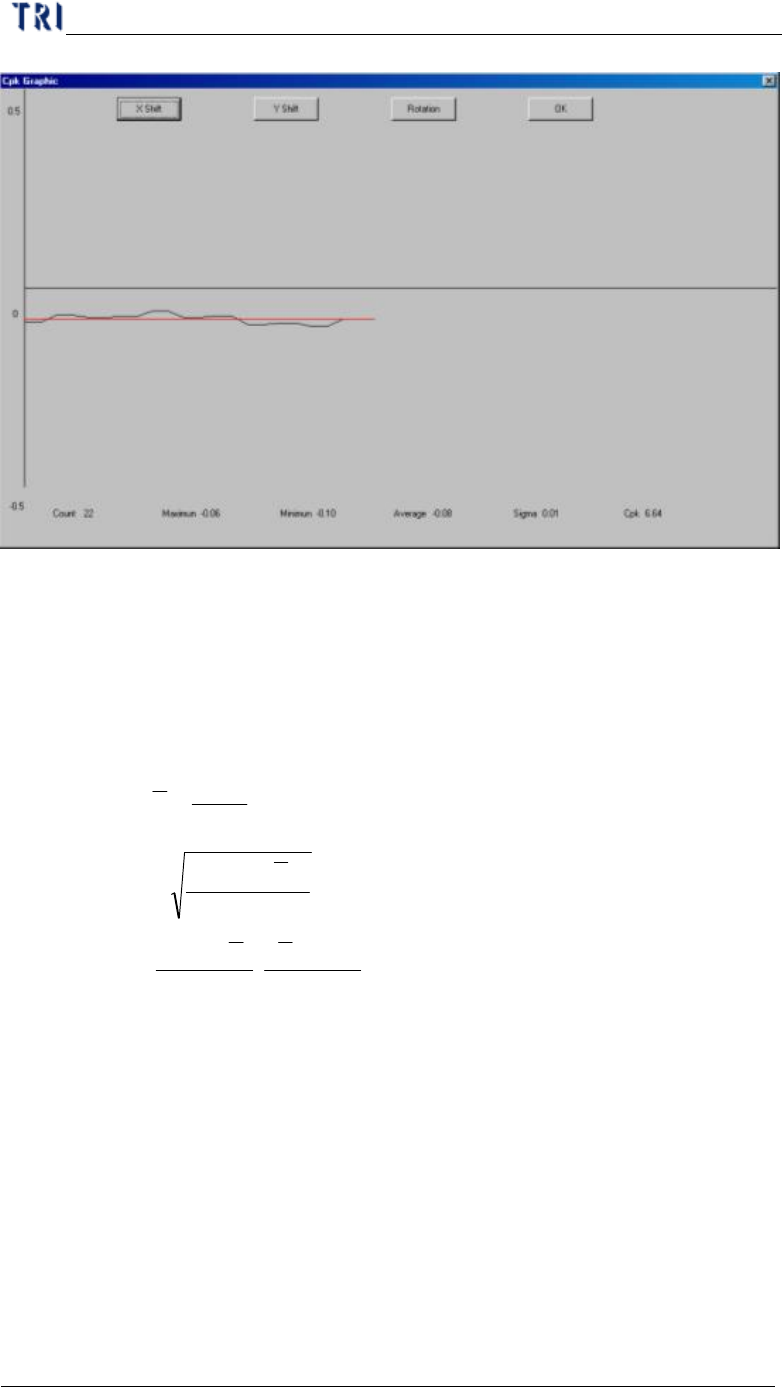
7.9.3. Formula
l
i
X=Result
l
n
=
countTest
l
n
X
∑
==
i
X
Average
l
1
)(
Sigma
2
−
−
==
∑
n
XX
i
σ
l
−−
=
σσ 3
)(
,
3
)( LSLXXUSL
MinC
pk
l USL and LSL present the upper spec limit and lower spec limit. You should set
the value when starting this function.
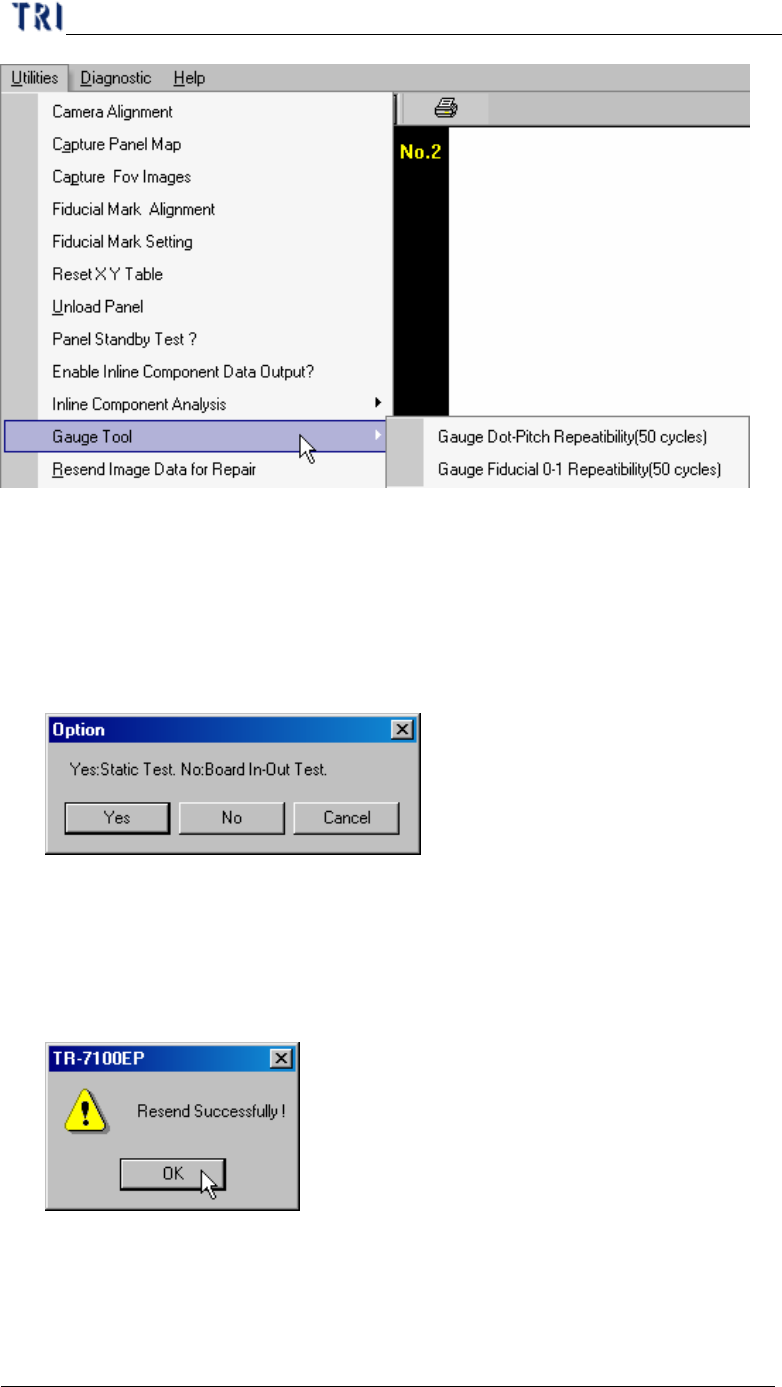
7.10. Gauge Tool
Chapter 2 Manual Bar introduce
TR7500 USER MANUAL
114
7.10.1. Gauge Fiducial 0-1 Repeatability (50 cycles)
l System measure the distance between two fiducial marks for 50 times and output
the result in [C:\AOI] folder. The first measurement file name is [fireport1.txt]
and the next file will be [fireport2.txt], [fireport3.txt] and so on. You can select
static or board in and out test.
7.11. Resend Image Data for Repair
l It is enabled when you select [Parameter/User Mode/Link to Repair Station].
Press the item and the system will send the data to repair station (Including *dir.1,
*.win, *.img, *.bmp).
7.12. Enable Inspection Data Collection
l You can select the item to save the result for all components as text file. The file
will be saved in the folder that project is saved in and the file name is