743844-015.pdf - 第57页
An update to the Linux* performance utility , with support for Intel ® PT , is available for download at https://github.com/virtuoso/linux -perf/tree/intel_pt . It requires rebuilding the kernel and the perf utility . Pl…
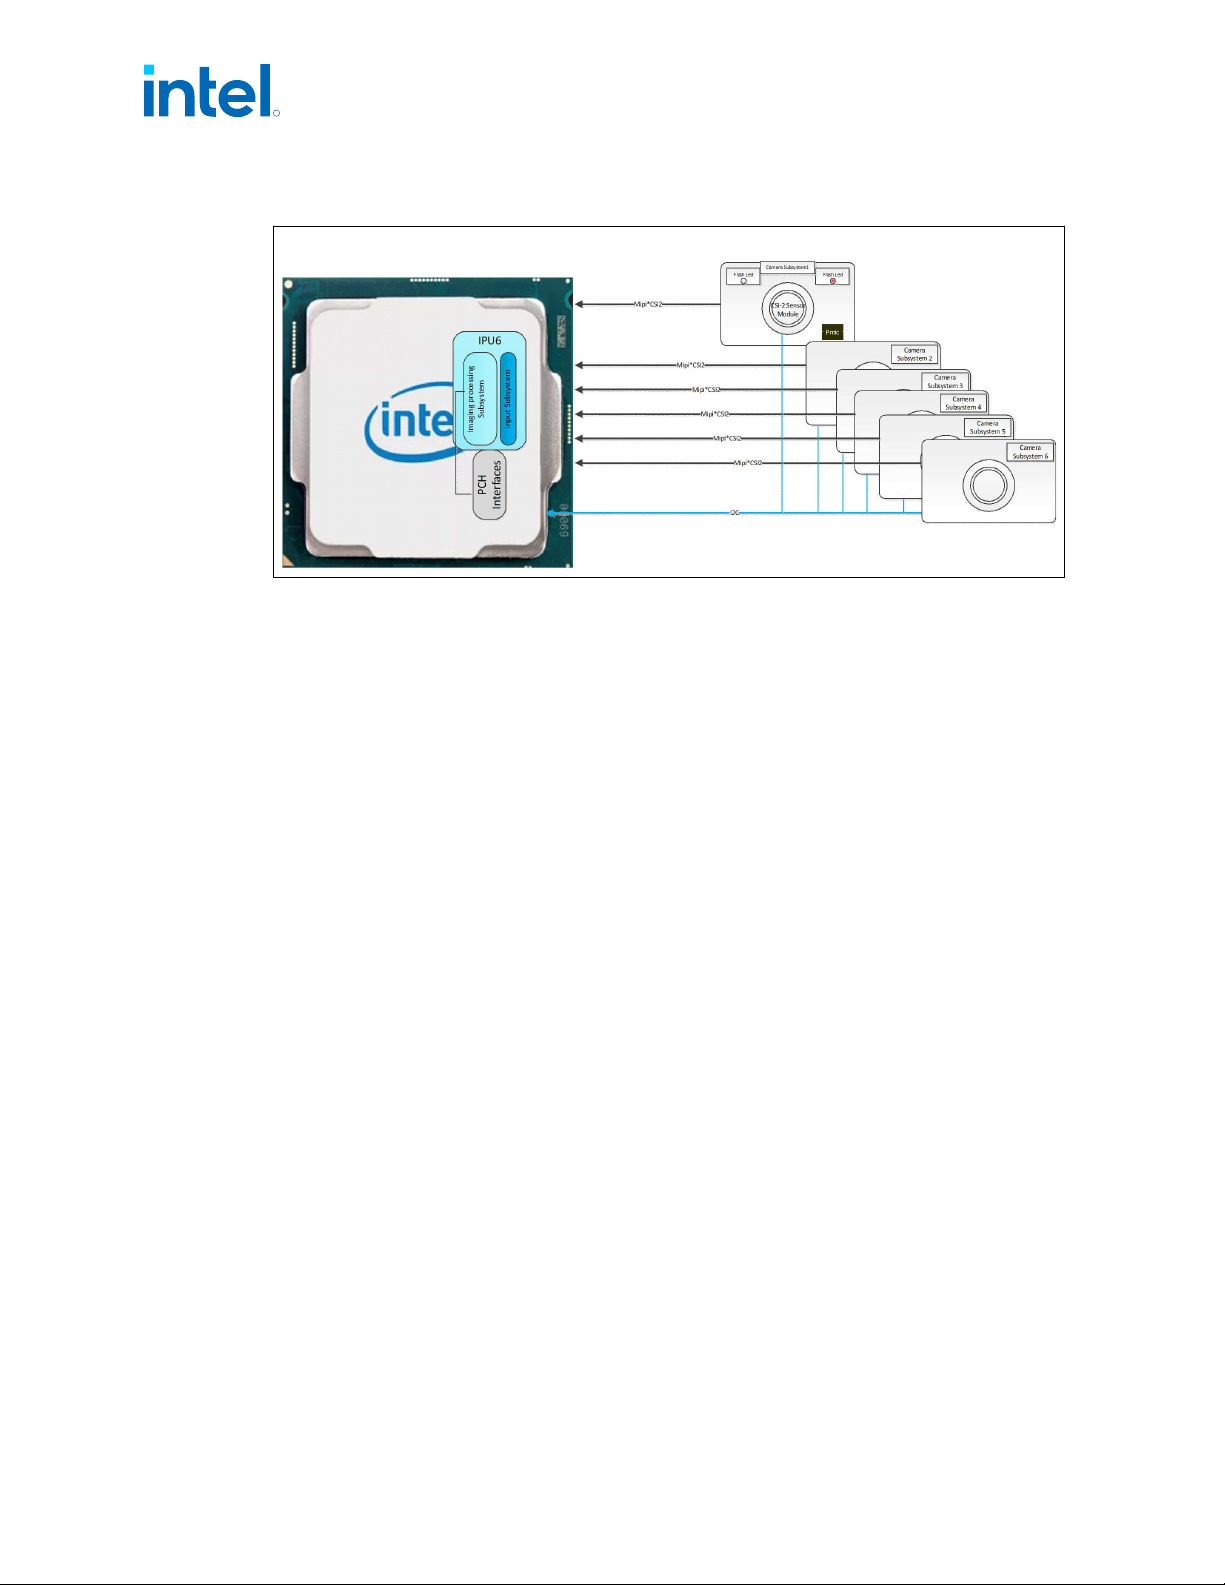
Figure 12. Processor Camera System
Intel
®
Image Processing Unit
IPU6 is Intel's 6th generation solution for an Imaging Processing Unit, providing
advanced imaging functionality for Intel
®
Core
™
branded processors, as well as more
specialized functionality for High Performance Mobile Phones, Automotive, Digital
Surveillance Systems (DSS), and other market segments.
IPU6 is a continuing evolution of the architecture introduced in IPU4 and enhanced in
IPU5. Additional image quality improvements are introduced, as well as hardware
accelerated support for temporal de-noising and new sensor technologies such as
Spatially Variant Exposure HDR and Dual Photo Diode, among others.
IPU6 provides a complete high quality hardware accelerated pipeline, and is therefore
not dependent on algorithms running on the vector processors to provide the highest
quality output.
• Processor Line has a lighter version of the IPU
Debug Technologies
Intel
®
Processor Trace
Intel
®
Processor Trace (Intel
®
PT) is a tracing capability added to Intel
®
Architecture,
for use in software debug and profiling. Intel
®
PT provides the capability for more
precise software control flow and timing information, with limited impact on software
execution. This provides an enhanced ability to debug software crashes, hangs, or
other anomalies, as well as responsiveness and short-duration performance issues.
Intel
®
VTune
™
Amplifier for Systems and the Intel
®
System Debugger are part of
Intel
®
System Studio 2015 (and newer) product, which includes updates for the new
debug and trace features, including Intel
®
PT and Intel
®
Trace Hub.
Intel
®
System Studio 2015 is available for download at
https://software.intel.com/en-
us/system-studio.
2.5.2
2.6
2.6.1
R
Intel
®
Core
™
, Xeon
™
6300 And Xeon
™
E 2400 Processors—Technologies
13
th
Generation Intel
®
Core
™
, Intel
®
Core
™
14
th
Generation, Intel
®
Core
™
Processor (Series 1) and (Series 2), Intel
®
Xeon
™
E
2400 Processor and Intel
®
Xeon
™
6300 Processor
Datasheet, Volume 1 of 2 May 2025
56 Doc. No.: 743844, Rev.: 015

An update to the Linux* performance utility, with support for Intel
®
PT, is available for
download at https://github.com/virtuoso/linux-perf/tree/intel_pt. It requires
rebuilding the kernel and the perf utility.
Platform CrashLog
• The CrashLog feature is intended for use by system builders (OEMs) as a means to
triage and perform first level debug of failures.
• CrashLog enables the BIOS or the OS to collect data on failures with the intent to
collect and classify the data as well as analyze failure trends.
• CrashLog is a mechanism to collect debug information into a single location and
then allow access to that data via multiple methods, including the BIOS and OS of
the failing system.
• CrashLog is initiated by a Crash Data Detector on observation of error conditions
(TCO watchdog timeout, machine check exceptions, etc.).
• Crash Data Detector notifies the Crash Data Requester of the error condition in
order for the Crash Data Requester to collect Crash Data from several different IPs
and/or Crash Nodes and stores the data to the Crash Data Storage (on-die SRAM)
prior to the reset.
• After the system has rebooted, the Crash Data Collector reads the Crash Data
from the Crash Data Storage and makes the data available to either to software
and/or back to a central server to track error frequency and trends.
Telemetry Aggregator
The Telemetry Aggregator serves as an architectural and discoverable interface to
hardware telemetry:
• Standardized PCIe discovery solution that enables software to discover and
manage telemetry across products
• Standardized definitions for telemetry decode, including data type definitions
• Exposure of commonly used telemetry for power and performance debug
including:
— P-State status, residency and counters
— C-State status, residency and counters
— Energy monitoring
— Device state monitoring (for example, PCIe L1)
— Interconnect/bus bandwidth counters
— Thermal monitoring
Exposure of SoC state snapshot for atomic monitoring of package power states,
uninterrupted by software that reads.
The Telemetry Aggregator is also a companion to the CrashLog feature where data is
captured about the SoC at the point of a crash. These counters can provide insights
into the nature of the crash.
2.6.2
2.6.3
R
Technologies—Intel
®
Core
™
, Xeon
™
6300 And Xeon
™
E 2400 Processors
13
th
Generation Intel
®
Core
™
, Intel
®
Core
™
14
th
Generation, Intel
®
Core
™
Processor (Series 1) and (Series 2), Intel
®
Xeon
™
E
2400 Processor and Intel
®
Xeon
™
6300 Processor
May 2025 Datasheet, Volume 1 of 2
Doc. No.: 743844, Rev.: 015 57
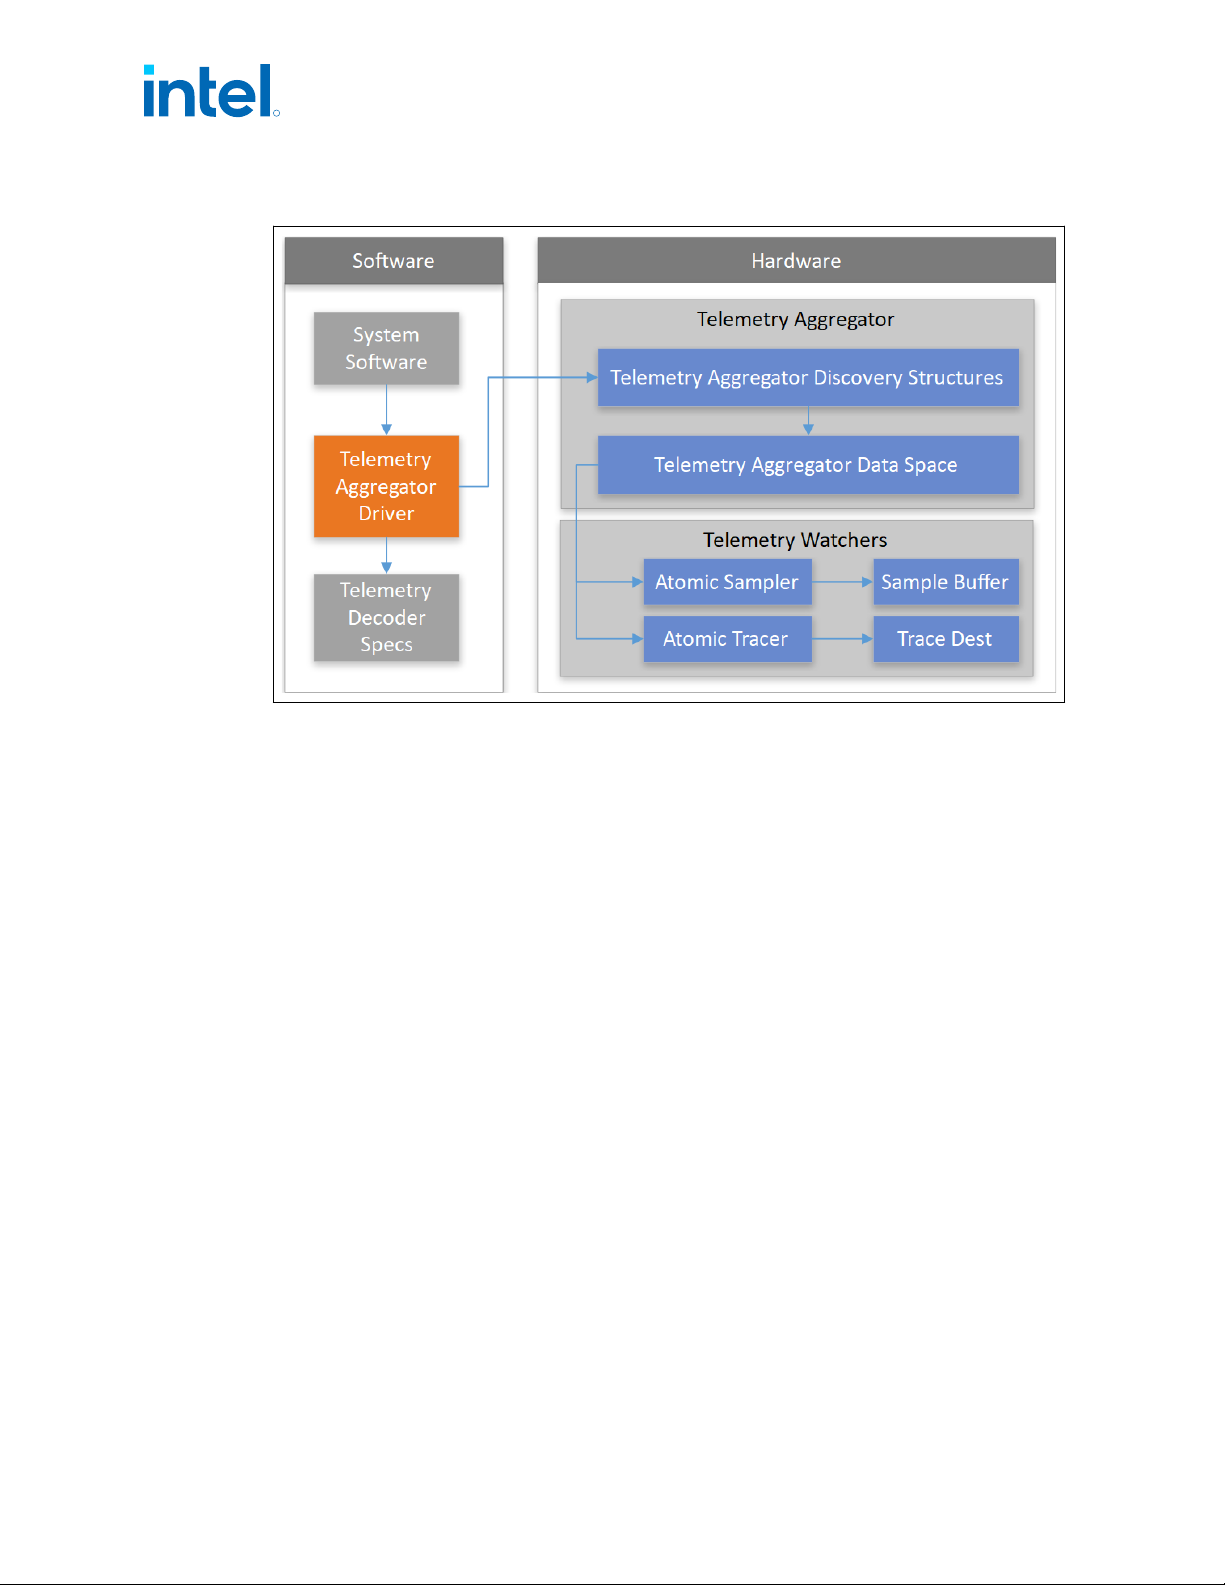
Figure 13. Telemetry Aggregator
Clock Topology
The processor has 3 reference clocks that drive the various components within the
SoC:
• Processor reference clock or base clock (BCLK). 100MHz with SSC.
• PCIe reference clock (PCTGLK). 100MHz with SSC.
• Fixed clock. 38.4MHz without SSC (crystal clock).
BCLK drives the following clock domains:
• Core
• Ring
• Graphics (GT)
• Memory Controller (MC)
• System Agent (SA)
PCTGLK drives the following clock domains:
• PCIe Controller(s)
• DMI/OPIO
Fixed clock drives the following clock domains:
• Display
• SVID controller
• Time Stamp Counters (TSC)
• Type C subsystem
2.7
R
Intel
®
Core
™
, Xeon
™
6300 And Xeon
™
E 2400 Processors—Technologies
13
th
Generation Intel
®
Core
™
, Intel
®
Core
™
14
th
Generation, Intel
®
Core
™
Processor (Series 1) and (Series 2), Intel
®
Xeon
™
E
2400 Processor and Intel
®
Xeon
™
6300 Processor
Datasheet, Volume 1 of 2 May 2025
58 Doc. No.: 743844, Rev.: 015