LCX_UserManual_en_08_1.pdf - 第100页
Instrument functions R&S ® LCX Series 100 User Manual 1 179.2260.02 ─ 08 The R&S LCX uploads the data and displays all information on the screen. Figure 8-19: Log chart result The labels of the parameter softkeys…
Instrument functions
R&S
®
LCX Series
99User Manual 1179.2260.02 ─ 08
- x1 +
Sets the resolution of the graphical display.
You can increase or decrease the resolution by the predefined multiplication factors
"x1", "x2", "x5", "x10", "x25" or "x50".
"+"
Increases the resolution stepwise by the given factors.
"-"
Decreases the resolution accordingly.
<touch capture indicator>
Indicates the focus with a vertical line when touching and dragging on the screen.
<traces>
Shows the results of the measured parameters as interpolated traces.
8.8.2.2 Displaying recordings in the log chart
To select the measurement parameter pairs:
► Proceed as described in "Selecting the parameters" on page 73
Remote commands:
FUNCtion:IMPedance[:TYPE][:PRIMary] on page 212
FUNCtion:IMPedance:TYPE:SECondary on page 213
Displaying the logging results in the chart viewer
To configure the logging chart view:
1. Press the [settings] key at the front panel.
2. In the "Functions" tab, select "Logging".
3. Select "Open Log Chart".
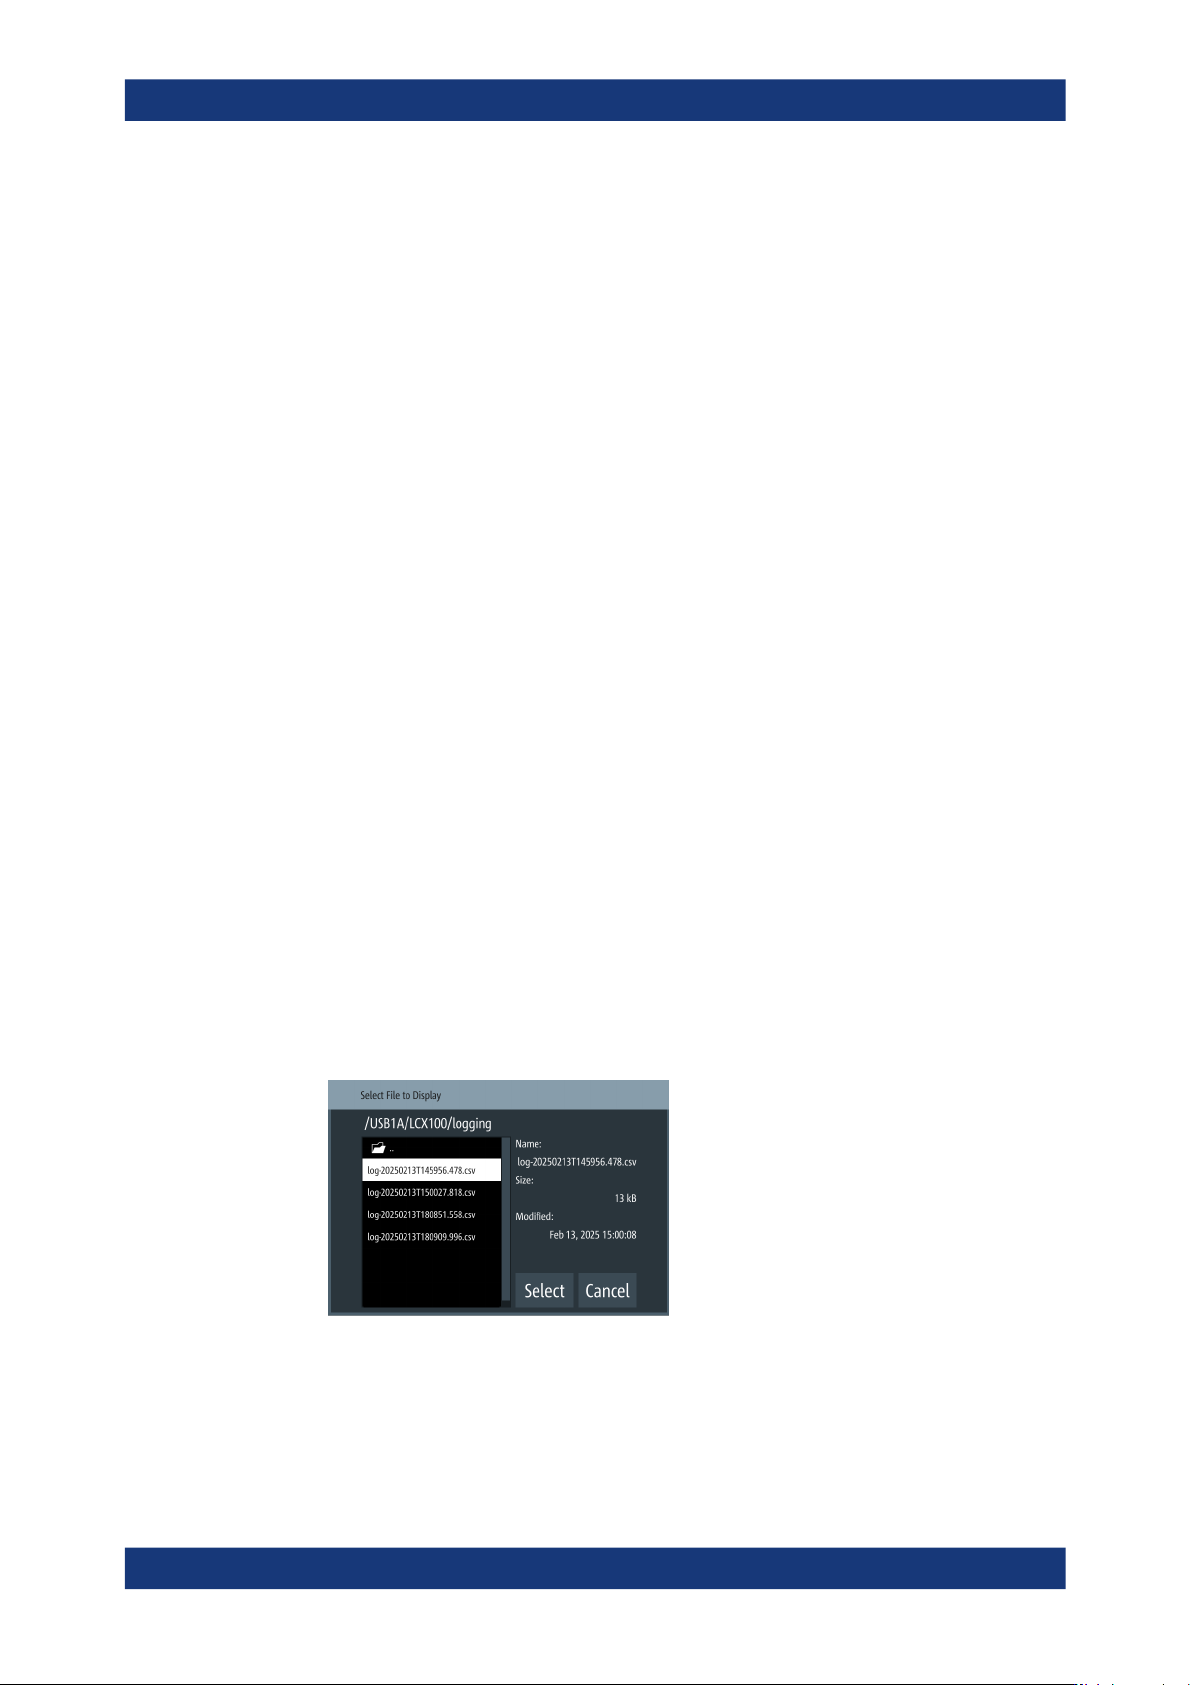
The R&S LCX opens a file selection dialog and prompts you to select a data log-
ging file.
Figure 8-18: Log file selection
a) Select a file to display.
b) Confirm with "Select".
Specific instrument functions
Instrument functions
R&S
®
LCX Series
100User Manual 1179.2260.02 ─ 08
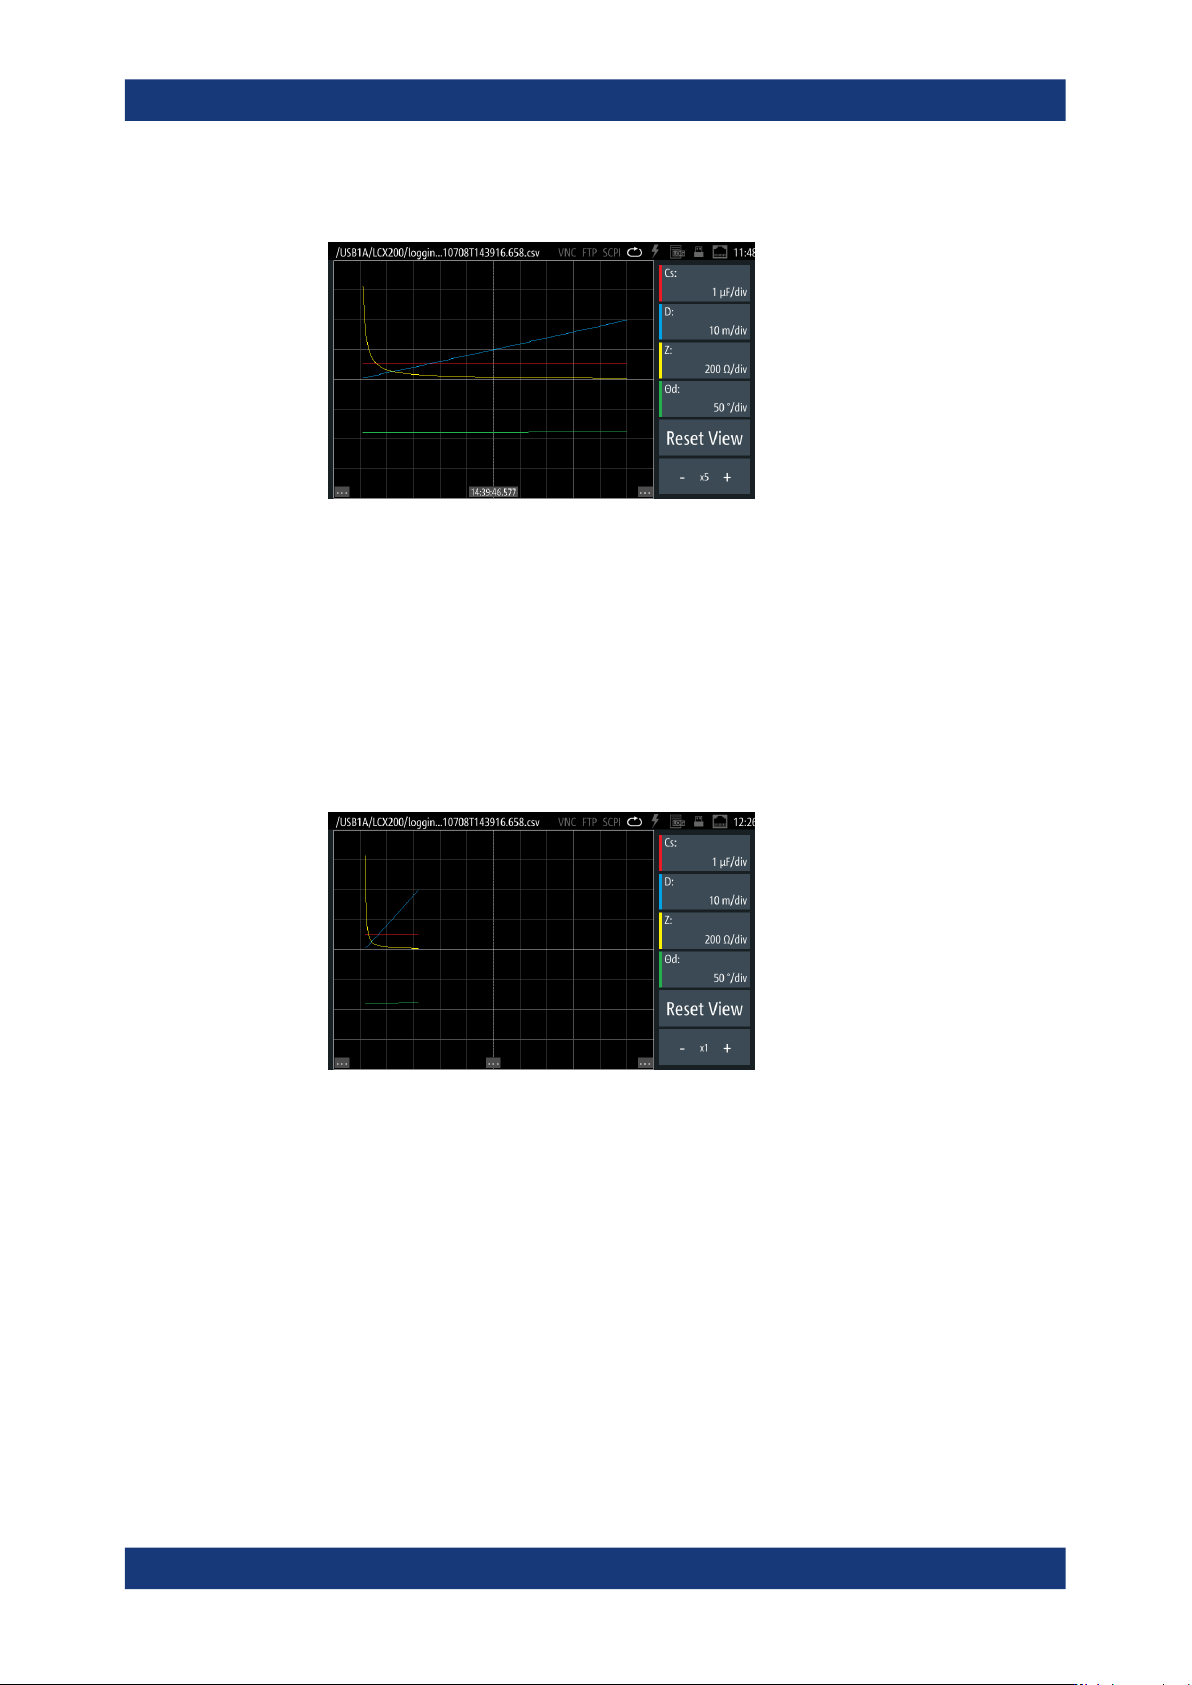
The R&S LCX uploads the data and displays all information on the screen.
Figure 8-19: Log chart result
The labels of the parameter softkeys indicate the measured parameter with the
respective unit per grid in the diagram. The colored bar of each softkey corre-
sponds to the trace color.
Customizing the log chart view
To shift the graph, or to adjust the trace colors or the resolution, you have the following
options:
1. If the chart is out of sight or has slipped to an edge:
Figure 8-20: Log chart view
Touch and drag over the diagram to shift the displayed area to the right or to the
left.
A touch capture indicator shows the position visually as long as you touch the
screen.
2. If the traces cover only a small area of the chart, increase the resolution by select-
ing the "+" of the "- x1 +" softkey.
Vice versa, decrease the resolution with the "-" of the softkey.
Tip: If you change the resolution, the graphic can slip to an edge or move out of
sight again. Shift it back with touch and drag.
3. To configure a parameter for display:
Specific instrument functions
Instrument functions
R&S
®
LCX Series
101User Manual 1179.2260.02 ─ 08
a) Select a parameter softkey on the right of the display.
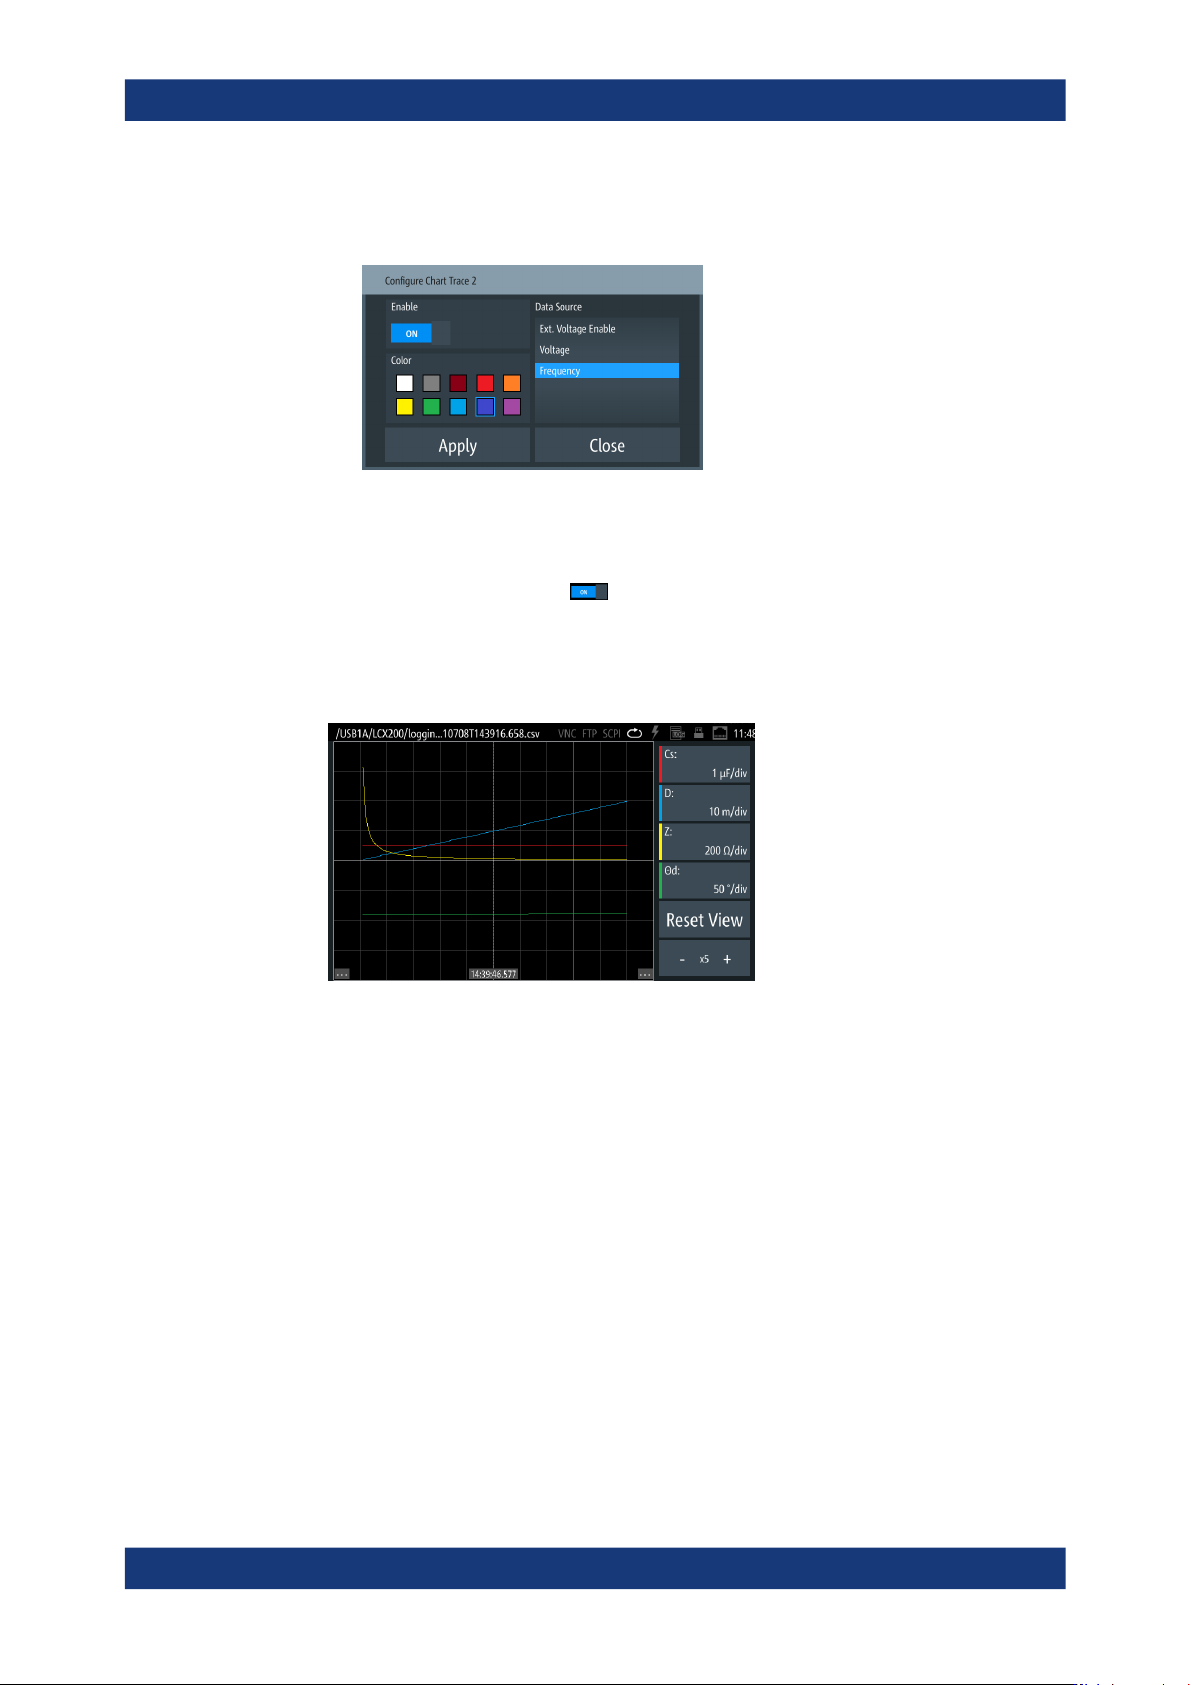
The "Configure Chart Trace <n>" dialog opens.
Figure 8-21: Configure chart trace dialog
b) In the "Data Source" list, select the measurement parameter, e.g. "Frequency".
c) Select a color for the parameter trace.
d)
To show the trace, turn "Enable".
e) Confirm with "Apply".
4. Repeat step 3 to assign additional traces.
The R&S LCX displays the customized chart accordingly.
Figure 8-22: Customized log chart
5. To return to the initial view, select "Reset View".
8.8.3 Logging
The logging function enables you to record the measurement data. You can save the
readings on the internal memory of the R&S LCX, or on an externally connected mem-
ory device, e.g. a USB flash drive. The function saves the data in a .csv file with a
generically generated filename.
Aspects on the logging function:
●
The R&S LCX does not support external USB hard disk drives (or USB exten-
sions).
We recommend that you use USB flash drives with FAT/FAT32 formatting. The
instrument recognizes the USB device automatically.
Specific instrument functions