LCX_UserManual_en_08_1.pdf - 第98页
Instrument functions R&S ® LCX Series 98 User Manual 1 179.2260.02 ─ 08 8.8.2.1 Log chart settings Access: 1. Press the [settings] key at the front panel. 2. In the "Functions" tab, select "Open Log Ch…
Instrument functions
R&S
®
LCX Series
97User Manual 1179.2260.02 ─ 08
Figure 8-15: Live chart view of a resistance measurement
8.8.2 Logging chart viewer
The logging chart viewer function enables you to display recorded measurement data
graphically and to evaluate and validate the results. You can view a previously recor-
ded measurement loaded from a file.
1
2
3
4
6
5
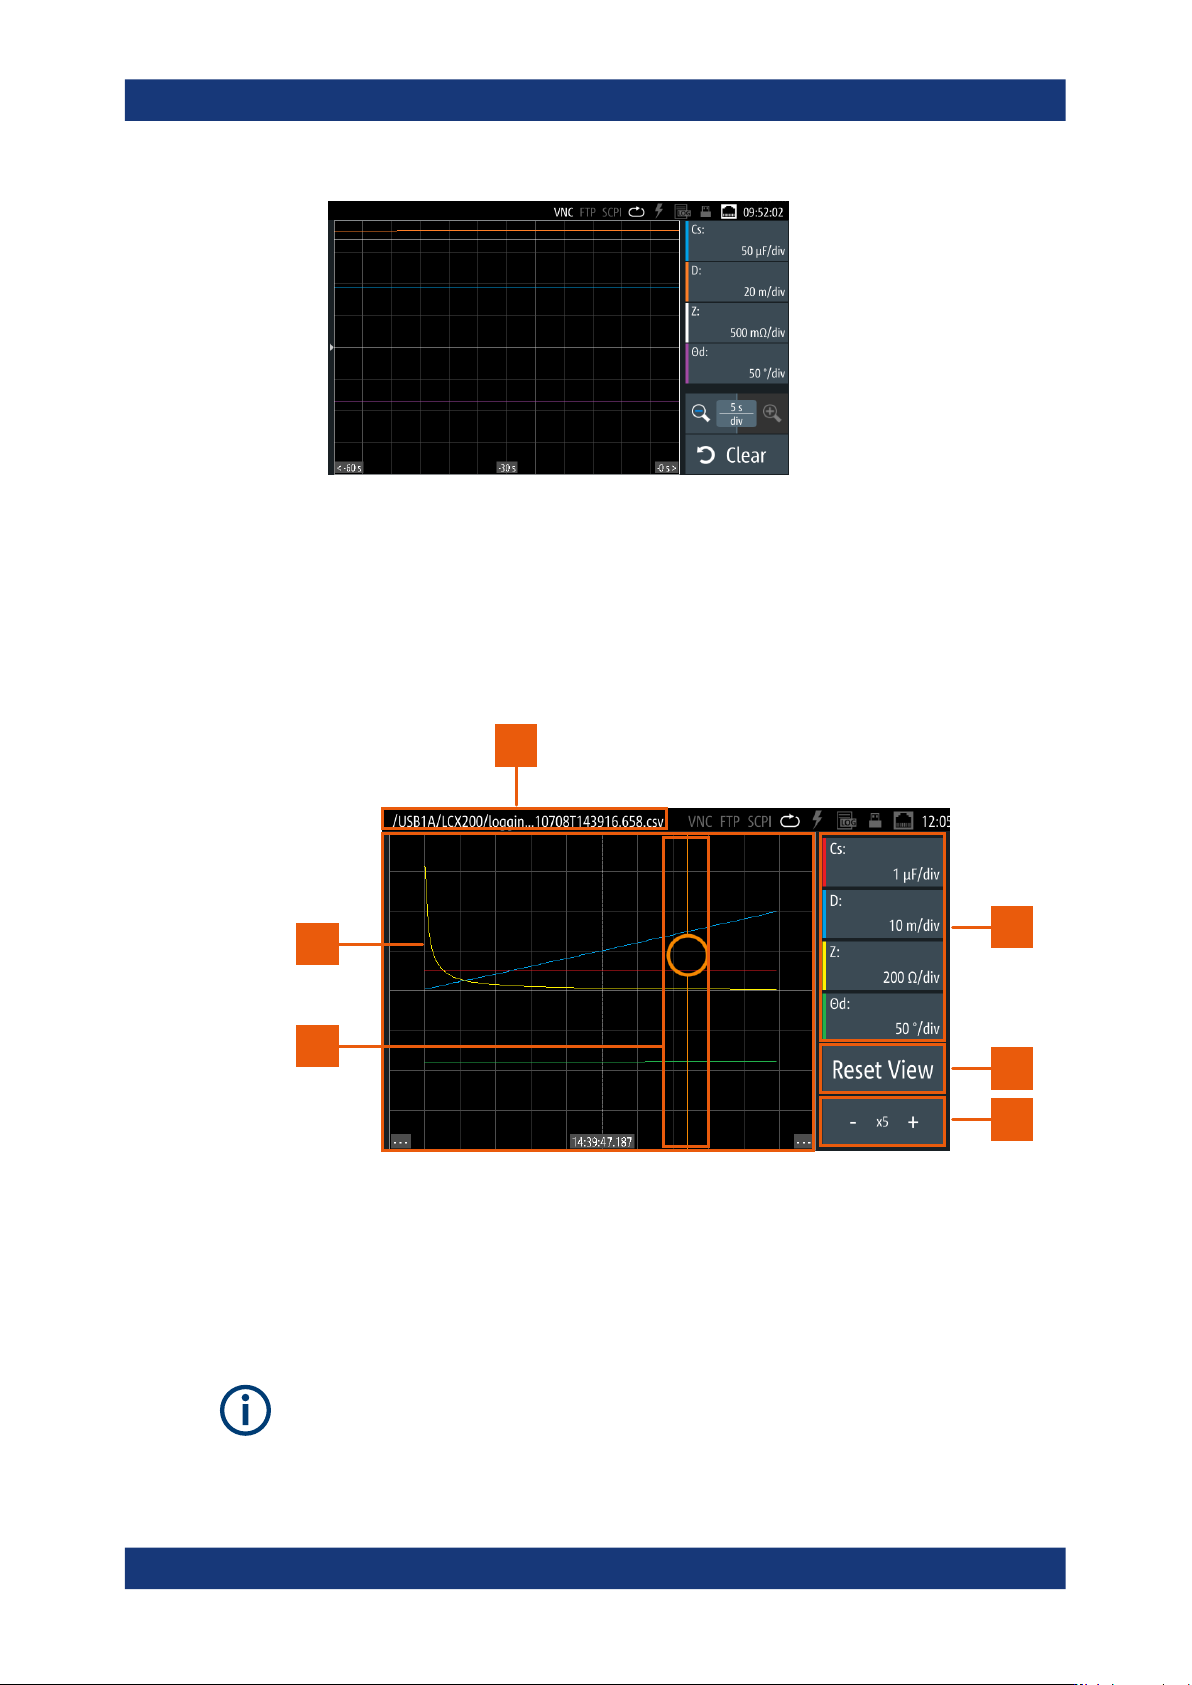
Figure 8-16: Log chart controls
1 = File name of the logging file
2 = Parameter pair softkeys
3 = Reset softkey
4 = Resolution softkey
5 = Capture indicator when touching and dragging within the graph
6 = Traces of the measured parameters
Gaps in a trace indicate invalid measurement results.
Specific instrument functions
Instrument functions
R&S
®
LCX Series
98User Manual 1179.2260.02 ─ 08
8.8.2.1 Log chart settings
Access:
1. Press the [settings] key at the front panel.
2. In the "Functions" tab, select "Open Log Chart".
The file selection dialog opens to load a previously recorded a data logging file.
3. Select a file as described in "Displaying the logging results in the chart viewer"
on page 99.
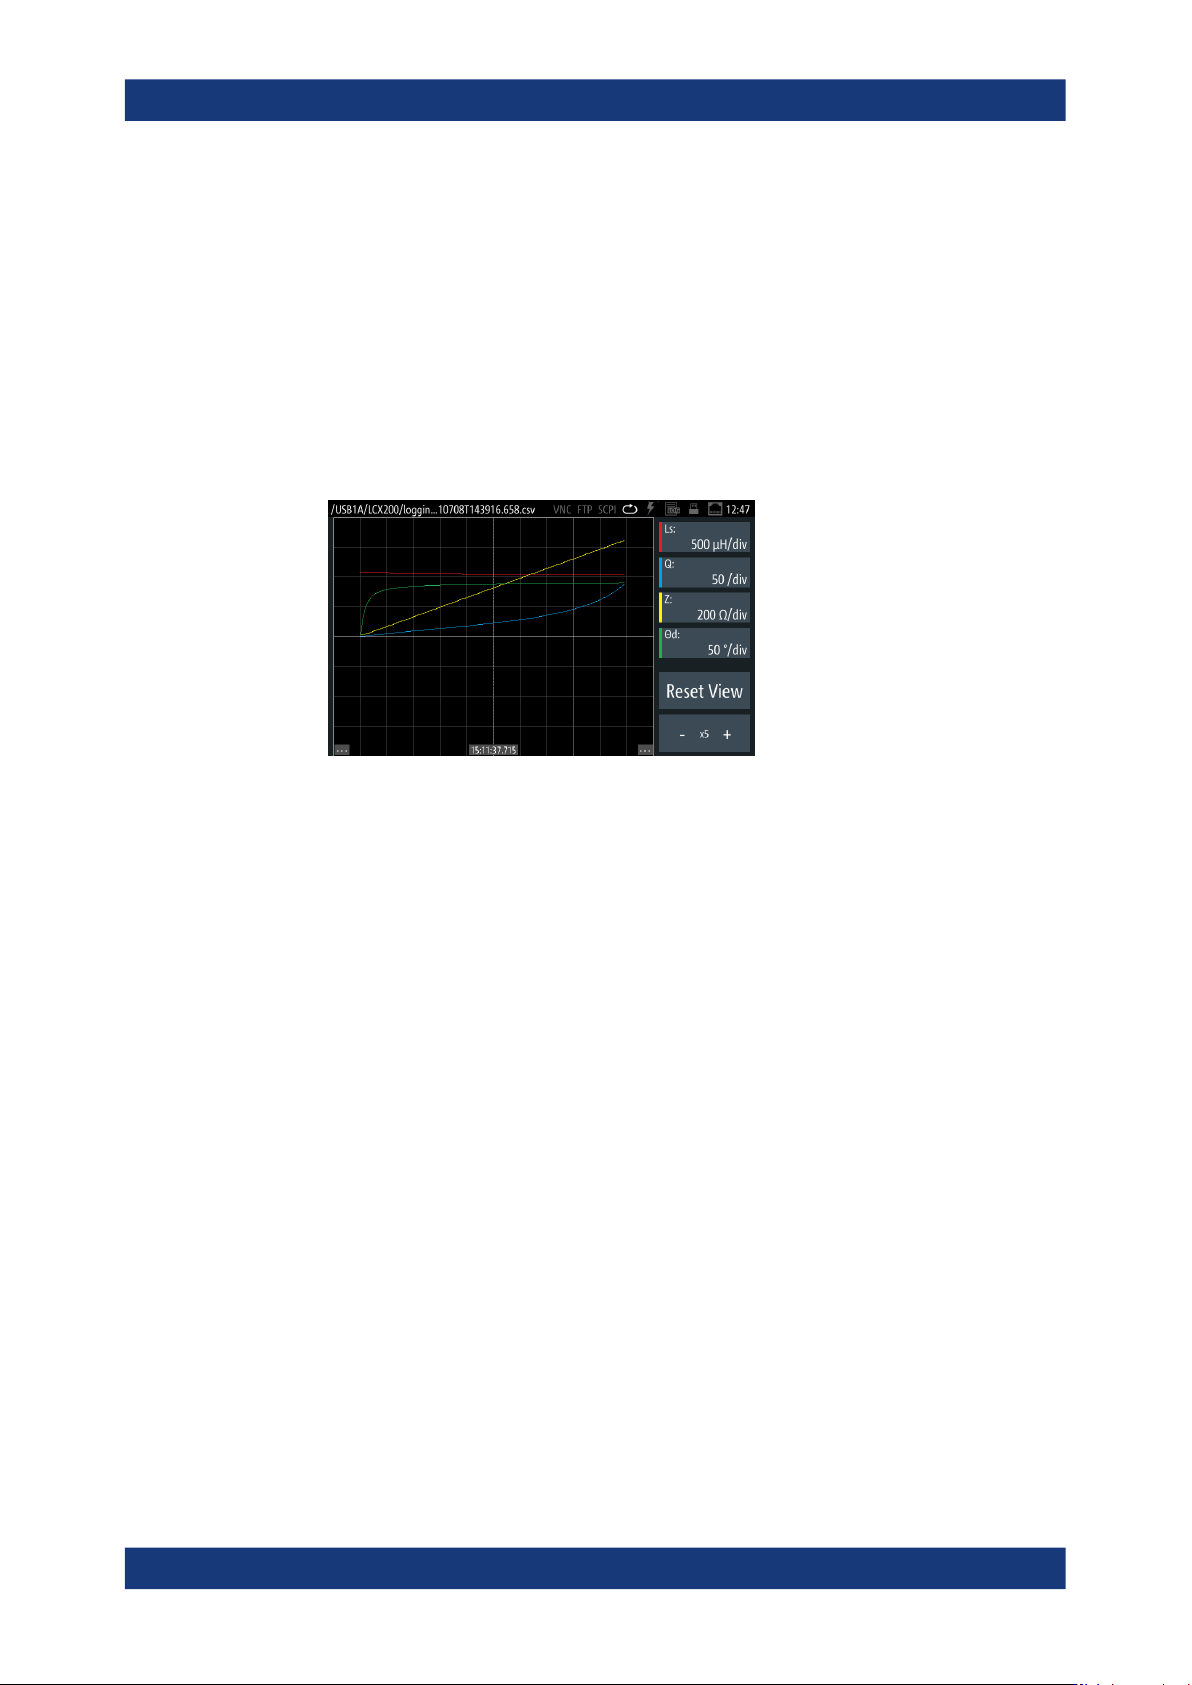
Figure 8-17: Log chart view
This view shows the measurement values of the primary and secondary parameter
pairs that have been recorded with the logging function. The softkeys enable you to
select the parameters for display according to your measurement.
How to: see Section 8.8.2.2, "Displaying recordings in the log chart", on page 99
<logging file name>.......................................................................................................98
<measurement pair>.....................................................................................................98
Reset View....................................................................................................................98
- x1 +............................................................................................................................. 99
<touch capture indicator>..............................................................................................99
<traces>........................................................................................................................ 99
<logging file name>
Indicates the filename of the loaded logging file.
Initially, the R&S LCX creates a filename composed of an identifier for a logging file
<log>, a time stamp and a generic number. File format and extension are .csv.
Remote command:
LOG:FNAMe on page 220
<measurement pair>
Indicates the measurement parameter pair taken from the log file.
Reset View
Resets the graphical display to the initial resolution.
Specific instrument functions
Instrument functions
R&S
®
LCX Series
99User Manual 1179.2260.02 ─ 08
- x1 +
Sets the resolution of the graphical display.
You can increase or decrease the resolution by the predefined multiplication factors
"x1", "x2", "x5", "x10", "x25" or "x50".
"+"
Increases the resolution stepwise by the given factors.
"-"
Decreases the resolution accordingly.
<touch capture indicator>
Indicates the focus with a vertical line when touching and dragging on the screen.
<traces>
Shows the results of the measured parameters as interpolated traces.
8.8.2.2 Displaying recordings in the log chart
To select the measurement parameter pairs:
► Proceed as described in "Selecting the parameters" on page 73
Remote commands:
FUNCtion:IMPedance[:TYPE][:PRIMary] on page 212
FUNCtion:IMPedance:TYPE:SECondary on page 213
Displaying the logging results in the chart viewer
To configure the logging chart view:
1. Press the [settings] key at the front panel.
2. In the "Functions" tab, select "Logging".
3. Select "Open Log Chart".
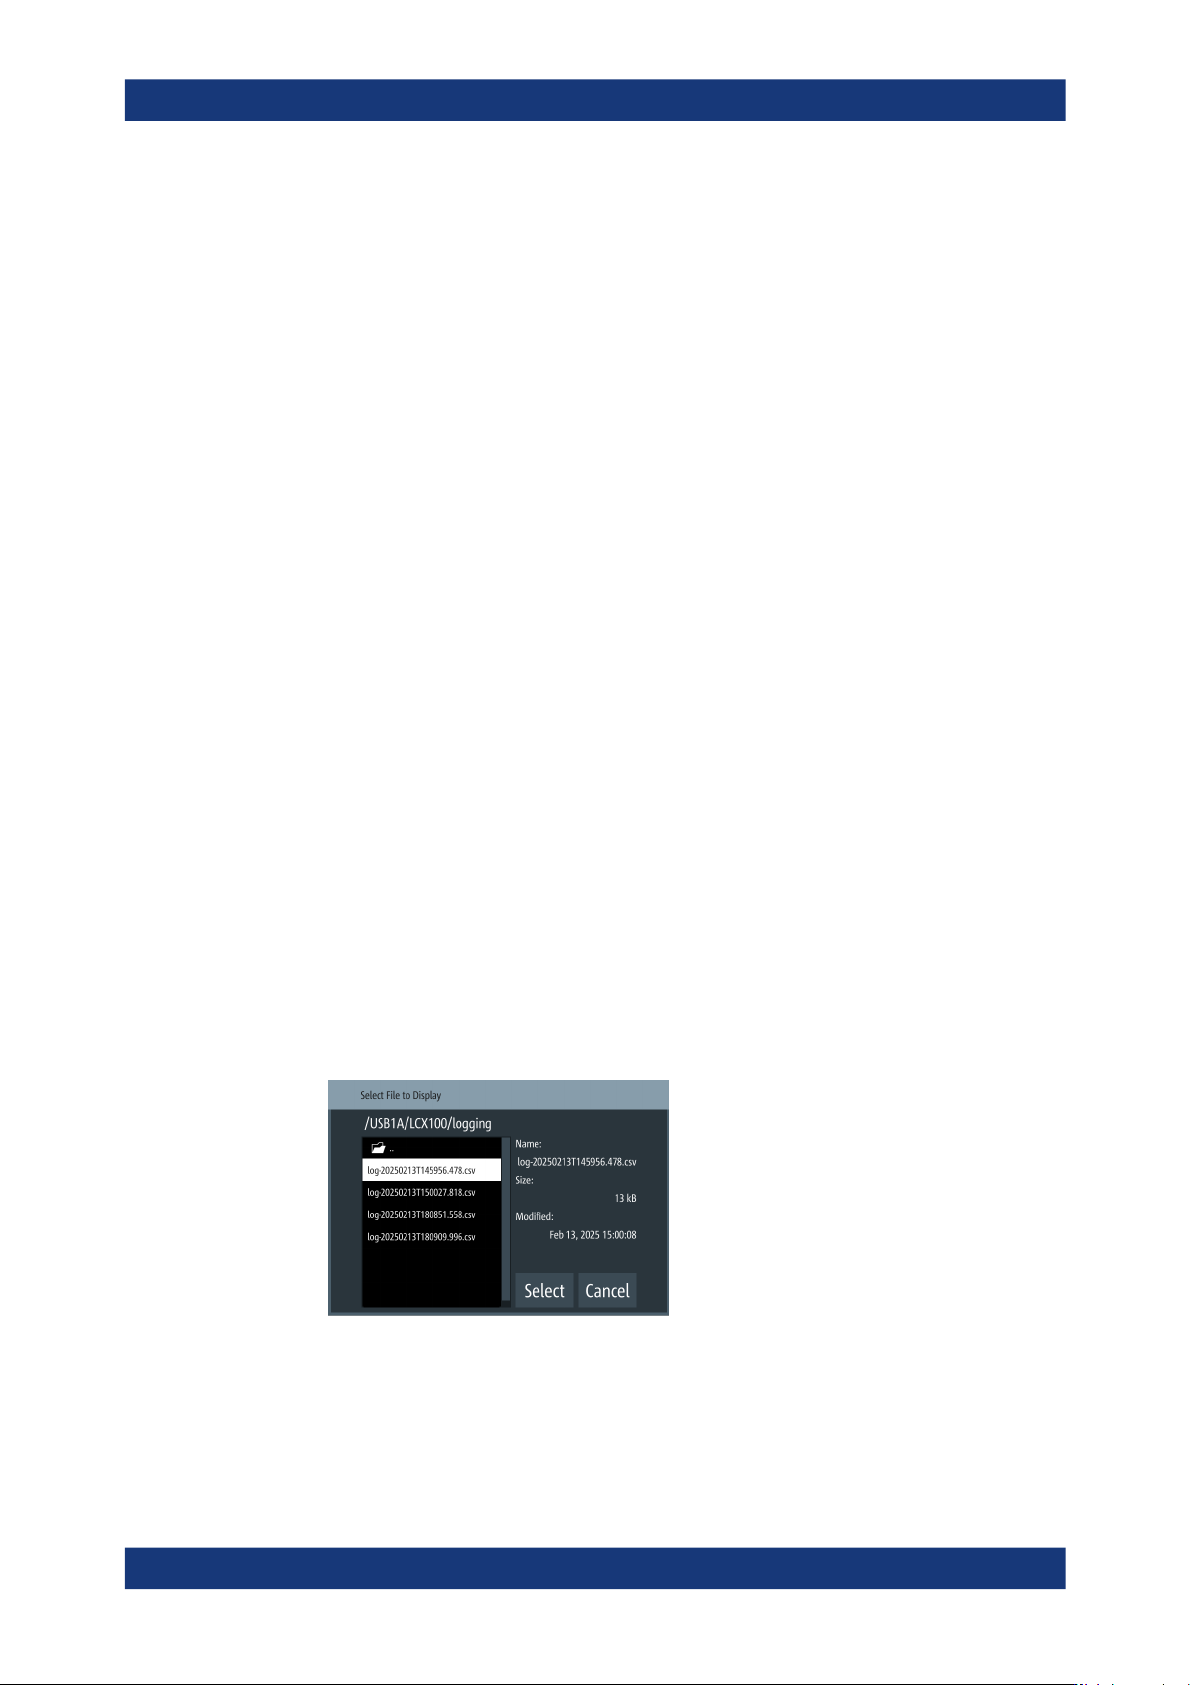
The R&S LCX opens a file selection dialog and prompts you to select a data log-
ging file.
Figure 8-18: Log file selection
a) Select a file to display.
b) Confirm with "Select".
Specific instrument functions