LCX_UserManual_en_08_1.pdf - 第94页
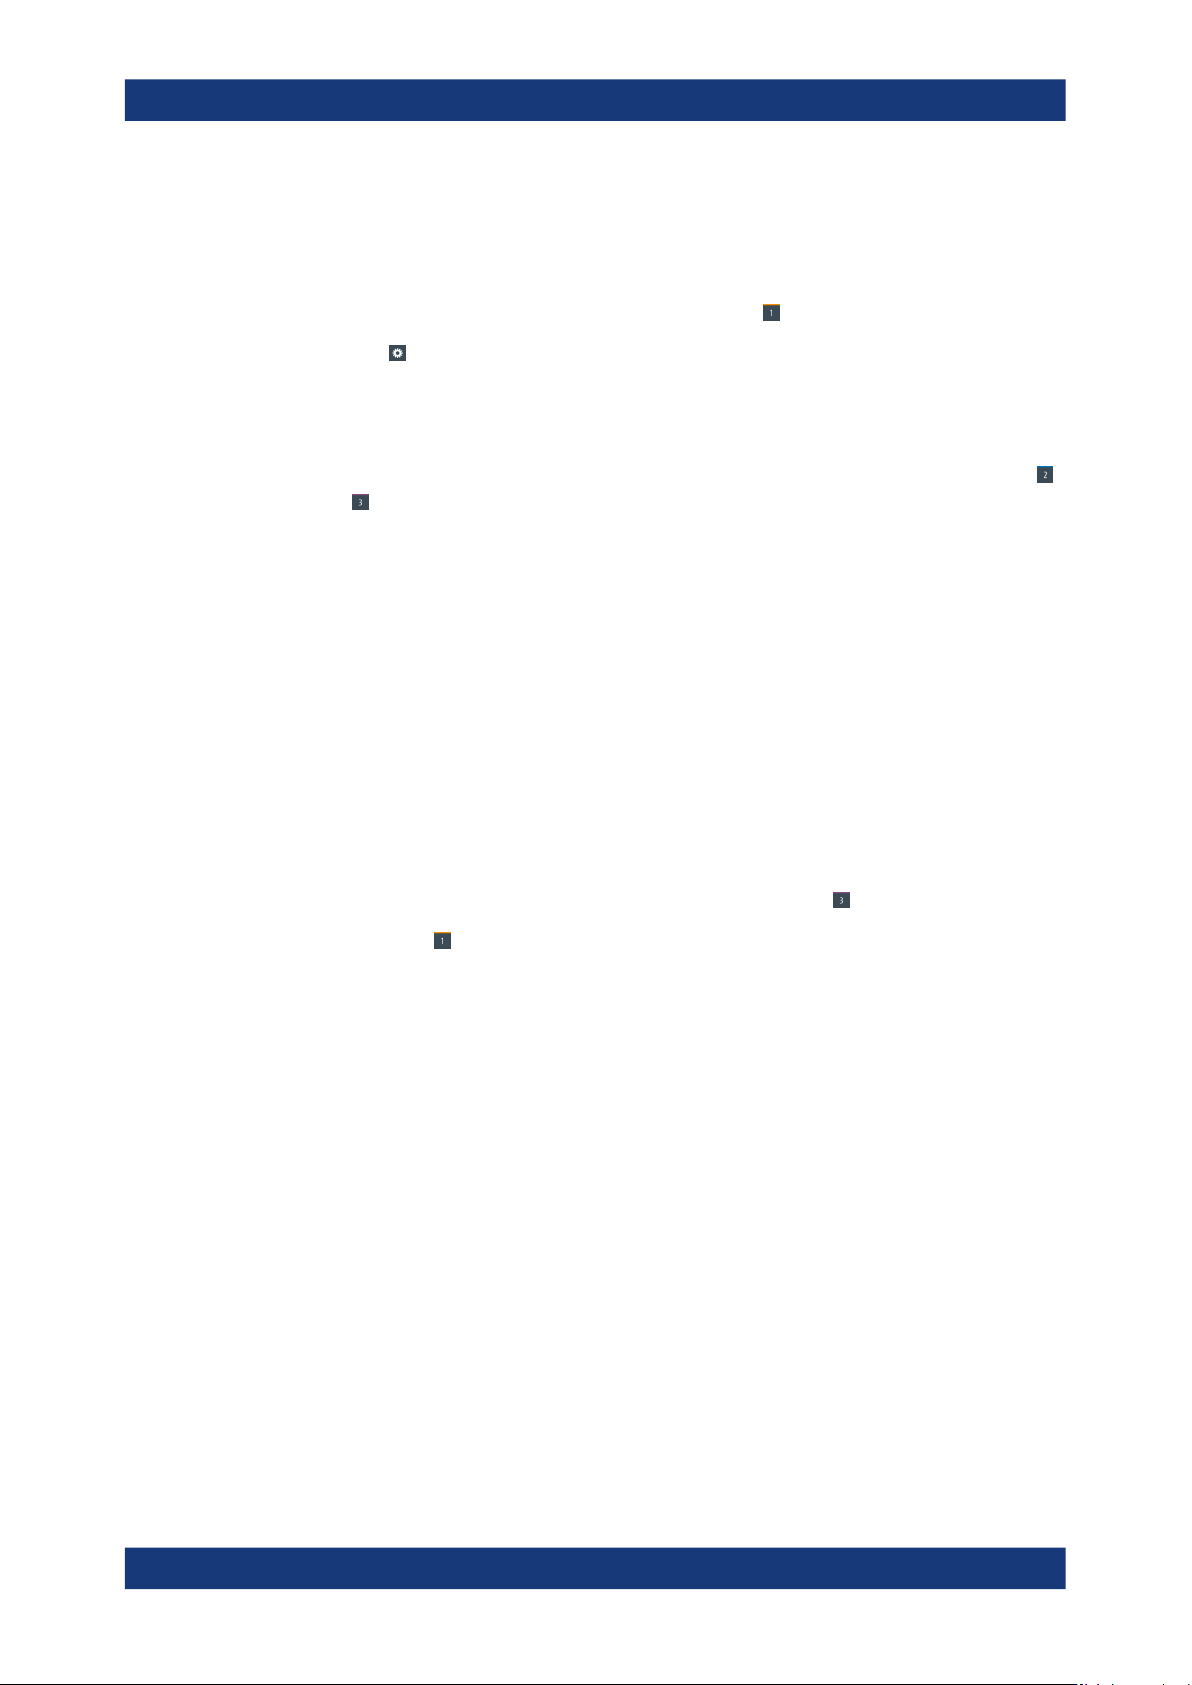
Instrument functions R&S ® LCX Series 94 User Manual 1 179.2260.02 ─ 08 Figure 8-1 1: Functions menu 3. Select the corresponding function in the list. ● Live chart viewer .............................................…
Instrument functions
R&S
®
LCX Series
93User Manual 1179.2260.02 ─ 08
Creating user-defined configuration presets
To create and save a configuration preset:
1.
Select the configuration preset memory slot, e.g. .
2.
Select to open the parameter settings dialog.
3. Set the corresponding parameters.
4. Press the home to return to the measurement window.
5.
To preset additional configurations, select another configuration preset slot, e.g.
or .
6. Repeat step 2 to step 5) until you have assigned all preset configurations.
Switching the configuration during a measurement
We assume that you have setup measurement and a DUT applied.
To execute a measurement with changing configuration:
1. Select the measurement function required for the measurement.
2. Set the test signal parameters.
3. Select the measurement parameters for results display.
4. Assign the configuration presets as described in "Creating user-defined configura-
tion presets" on page 93.
5.
Start the measurement, e.g. using a configuration preset
.
6.
Select, e.g. to continue the measurement with different settings.
While the measurement is running, you can switch between the preset configura-
tions arbitrarily.
8.8 Specific instrument functions
This secttion describes the features the instrument provides in addition to the basic
measurement functions. Some specific functions require that the corresponding
options are installed.
Access:
1. Press the [settings] key at the front panel.
2. Select the "Functions" tab.
Specific instrument functions
Instrument functions
R&S
®
LCX Series
94User Manual 1179.2260.02 ─ 08
Figure 8-11: Functions menu
3. Select the corresponding function in the list.
● Live chart viewer..................................................................................................... 94
● Logging chart viewer...............................................................................................97
● Logging................................................................................................................. 101
● Dynamic impedance measurement.......................................................................106
● Binning.................................................................................................................. 110
8.8.1 Live chart viewer
The live chart view enables you to evaluate and validate the current measurement
graphically.
1
1
2
3
7
5
4
6
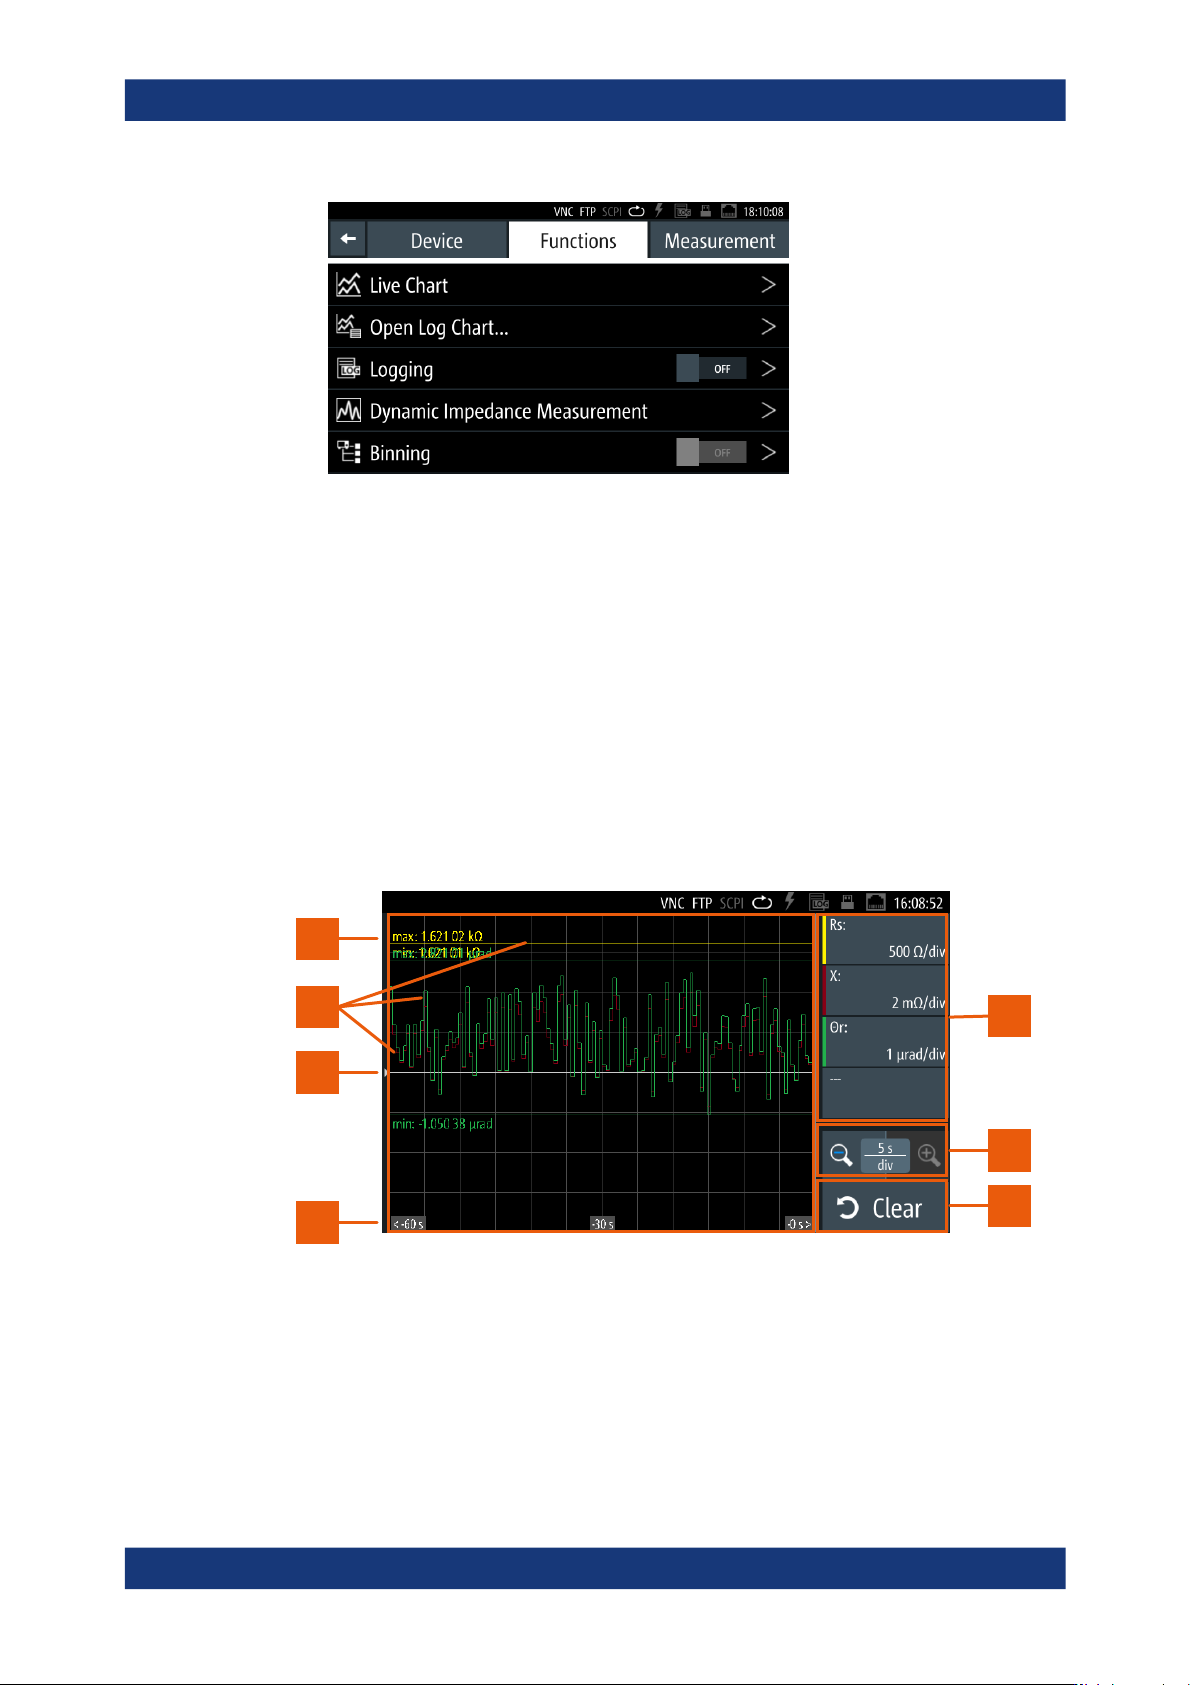
Figure 8-12: Live chart display and controls
1 = Parameter pair softkeys
2 = Time base scaling
3 = Reset softkey
4 = Time axis
Specific instrument functions
Instrument functions
R&S
®
LCX Series
95User Manual 1179.2260.02 ─ 08
5 = Zero reference
6 = Measurement traces
7 = Min/max values of parameters
● Live chart settings................................................................................................... 95
● Displaying the readings in the live chart..................................................................96
8.8.1.1 Live chart settings
Access:
You have two options to open the live chart view:
1. Open from the functions tab:
a) Press the [settings] key at the front panel.
b) In the "Functions" tab, select "Live Chart".
2. Open with the display mode key:
a) At the front panel, press the [Display Mode] key repeatedly until the graphical
display appears.
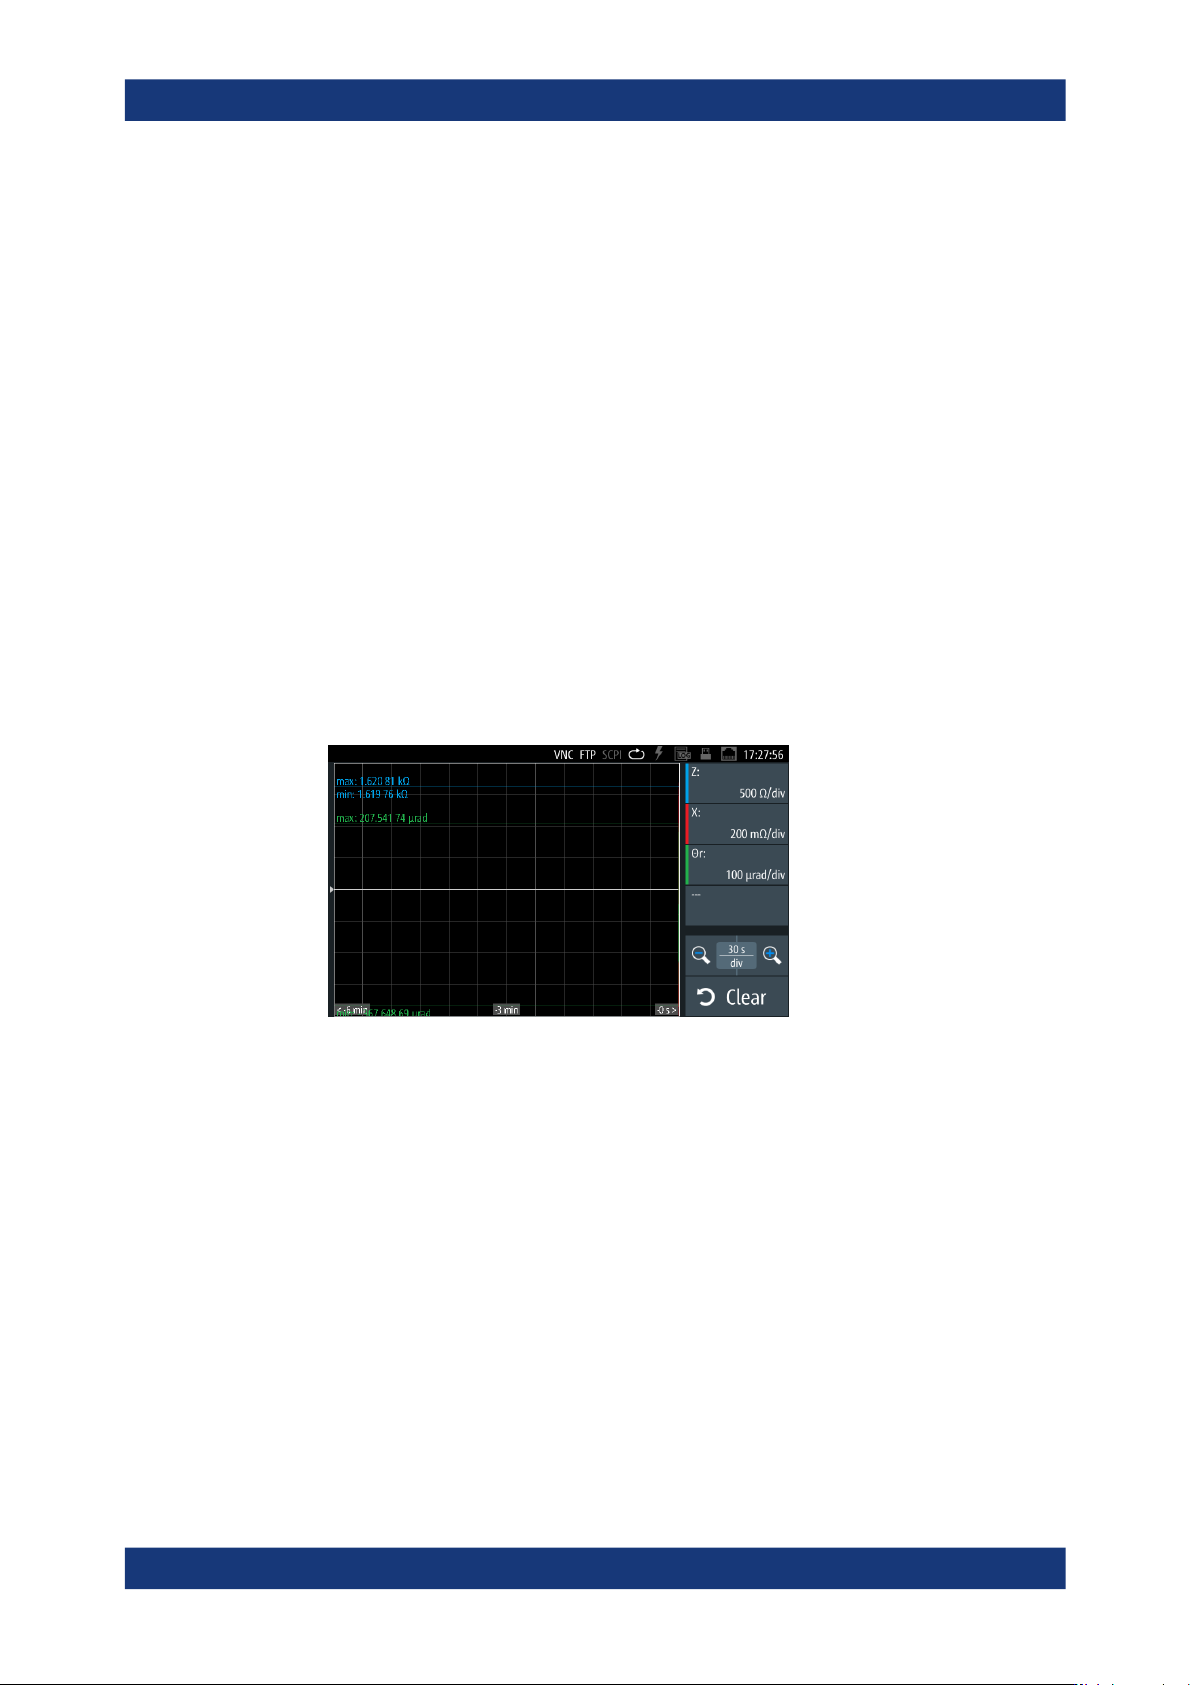
Figure 8-13: Live chart view
This view preselects and shows the measurement values of the current primary
and secondary measurement pairs. The softkeys enable you to select the parame-
ters and configure the display according to your measurement.
How to: see Section 8.8.1.2, "Displaying the readings in the live chart", on page 96
<measurement pair>.....................................................................................................95
<nn s/div>......................................................................................................................95
Clear..............................................................................................................................96
<measurement pair>
Indicates the selected measurement parameter pair with the specified unit per division.
<nn s/div>
Indicates the time scaling of the x-axis in the chart.
Specific instrument functions