LCX_UserManual_en_08_1.pdf - 第95页
Instrument functions R&S ® LCX Series 95 User Manual 1 179.2260.02 ─ 08 5 = Zero reference 6 = Measurement traces 7 = Min/max values of parameters ● Live chart settings ...............................................…
Instrument functions
R&S
®
LCX Series
94User Manual 1179.2260.02 ─ 08
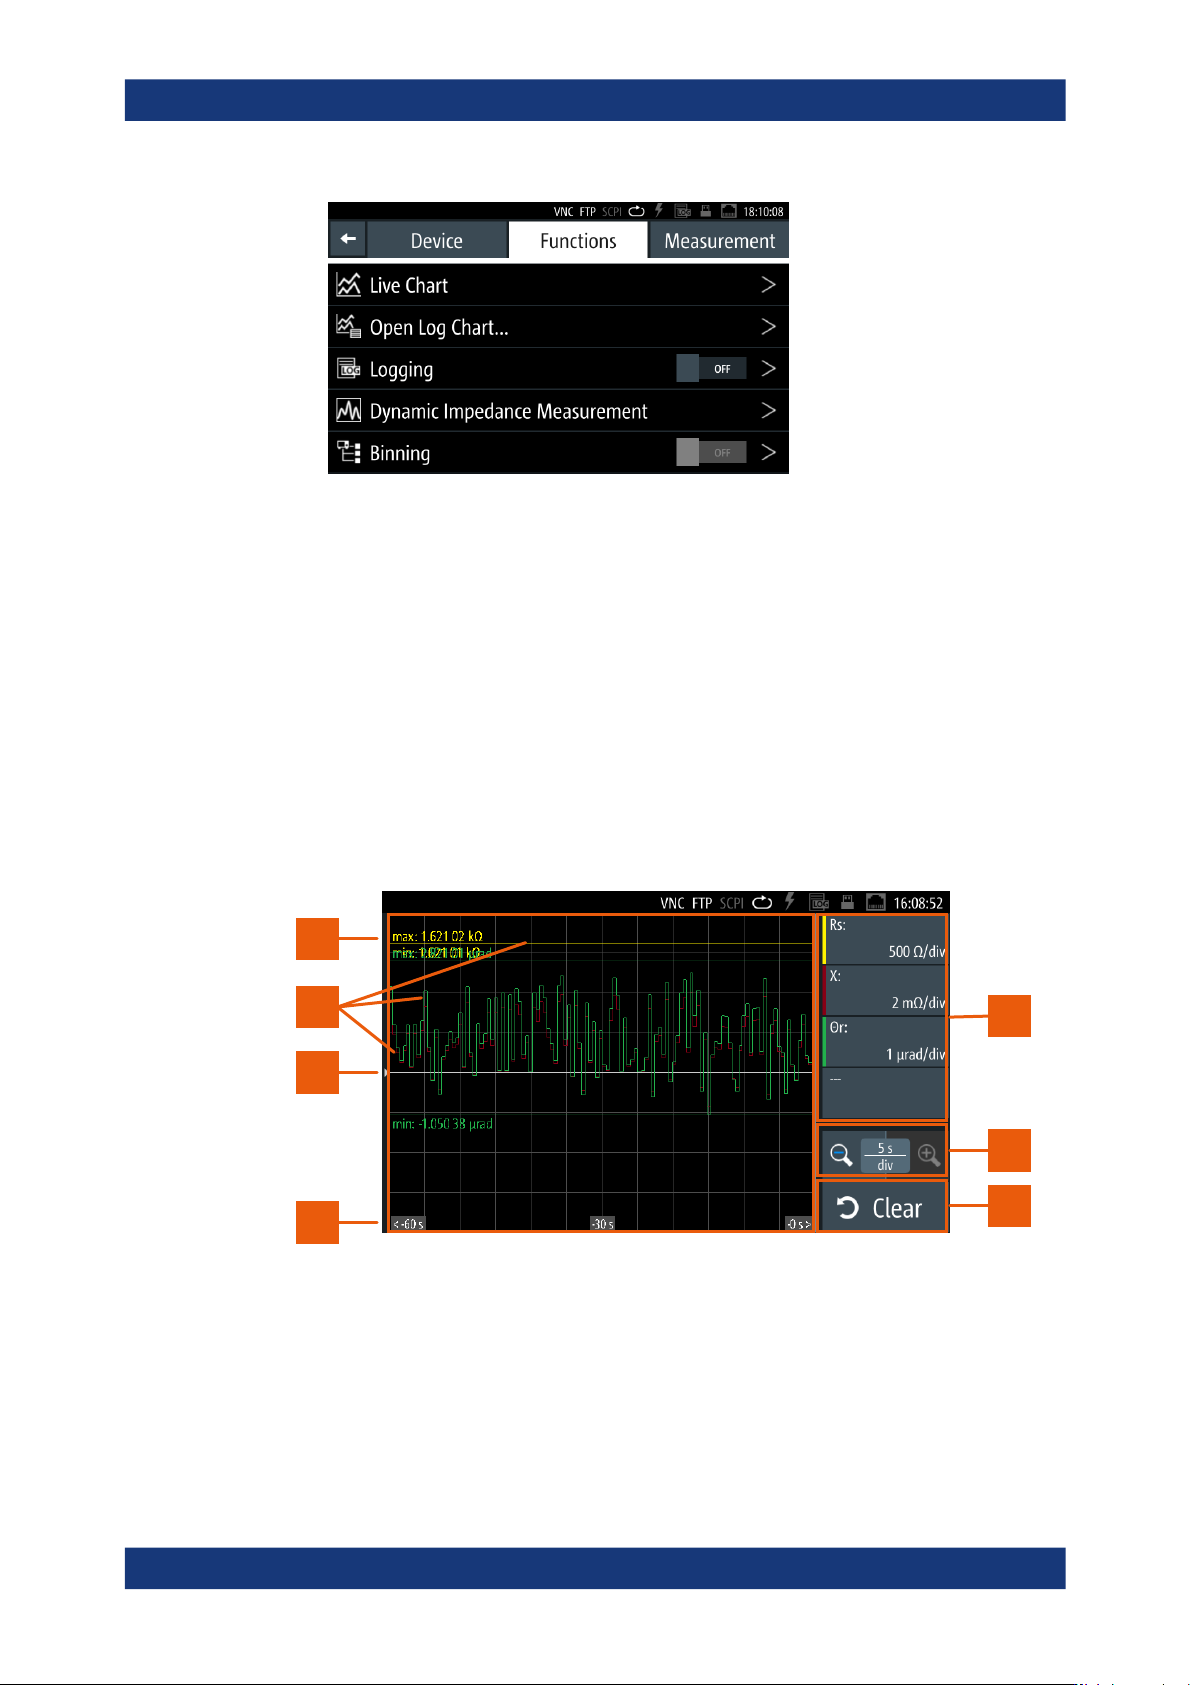
Figure 8-11: Functions menu
3. Select the corresponding function in the list.
● Live chart viewer..................................................................................................... 94
● Logging chart viewer...............................................................................................97
● Logging................................................................................................................. 101
● Dynamic impedance measurement.......................................................................106
● Binning.................................................................................................................. 110
8.8.1 Live chart viewer
The live chart view enables you to evaluate and validate the current measurement
graphically.
1
1
2
3
7
5
4
6
Figure 8-12: Live chart display and controls
1 = Parameter pair softkeys
2 = Time base scaling
3 = Reset softkey
4 = Time axis
Specific instrument functions
Instrument functions
R&S
®
LCX Series
95User Manual 1179.2260.02 ─ 08
5 = Zero reference
6 = Measurement traces
7 = Min/max values of parameters
● Live chart settings................................................................................................... 95
● Displaying the readings in the live chart..................................................................96
8.8.1.1 Live chart settings
Access:
You have two options to open the live chart view:
1. Open from the functions tab:
a) Press the [settings] key at the front panel.
b) In the "Functions" tab, select "Live Chart".
2. Open with the display mode key:
a) At the front panel, press the [Display Mode] key repeatedly until the graphical
display appears.
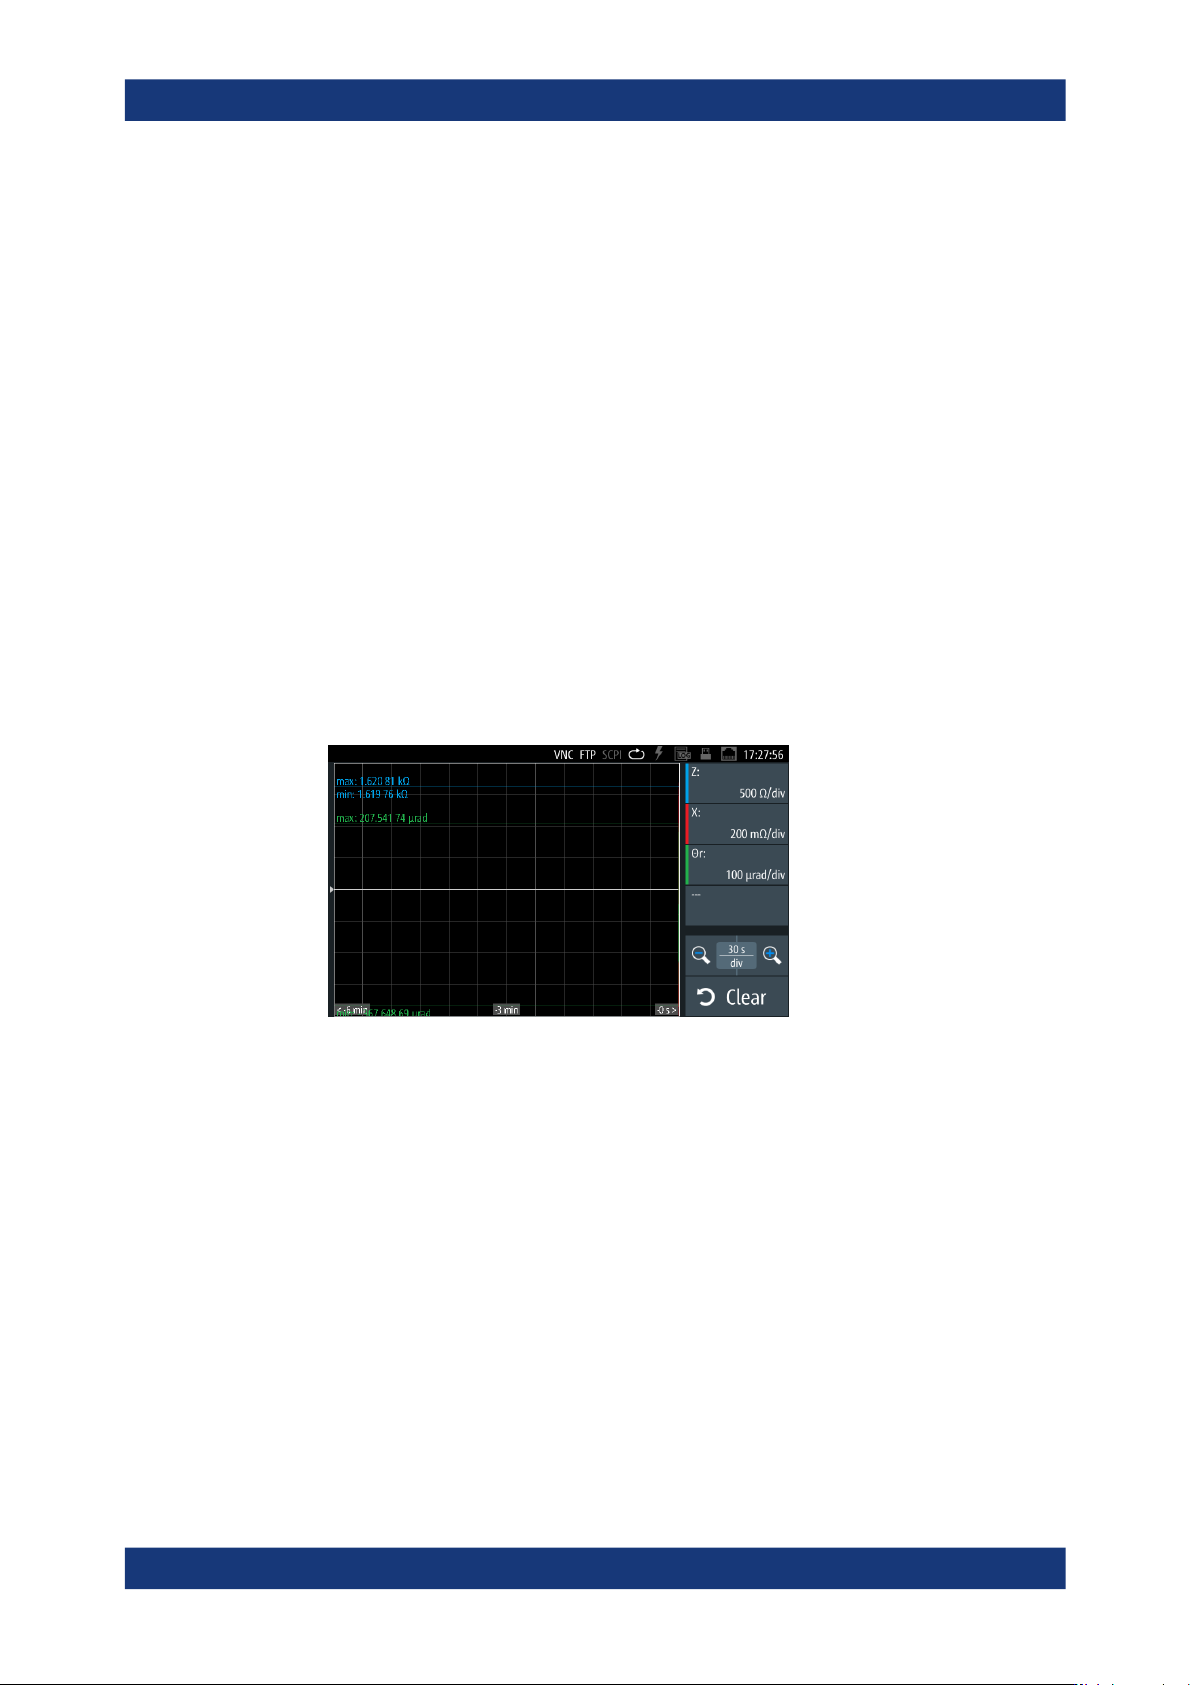
Figure 8-13: Live chart view
This view preselects and shows the measurement values of the current primary
and secondary measurement pairs. The softkeys enable you to select the parame-
ters and configure the display according to your measurement.
How to: see Section 8.8.1.2, "Displaying the readings in the live chart", on page 96
<measurement pair>.....................................................................................................95
<nn s/div>......................................................................................................................95
Clear..............................................................................................................................96
<measurement pair>
Indicates the selected measurement parameter pair with the specified unit per division.
<nn s/div>
Indicates the time scaling of the x-axis in the chart.
Specific instrument functions
Instrument functions
R&S
®
LCX Series
96User Manual 1179.2260.02 ─ 08
Clear
Resets the chart and restarts the graphical display of the measurement.
8.8.1.2 Displaying the readings in the live chart
Displaying the results graphically
To display the measurement progress and the readings in the live chart view:
1. Press the [settings] key at the front panel.
2. In the "Functions" tab, select "Live Chart".
3. To configure a parameter for display:
a) Select a parameter softkey on the right of the screen.
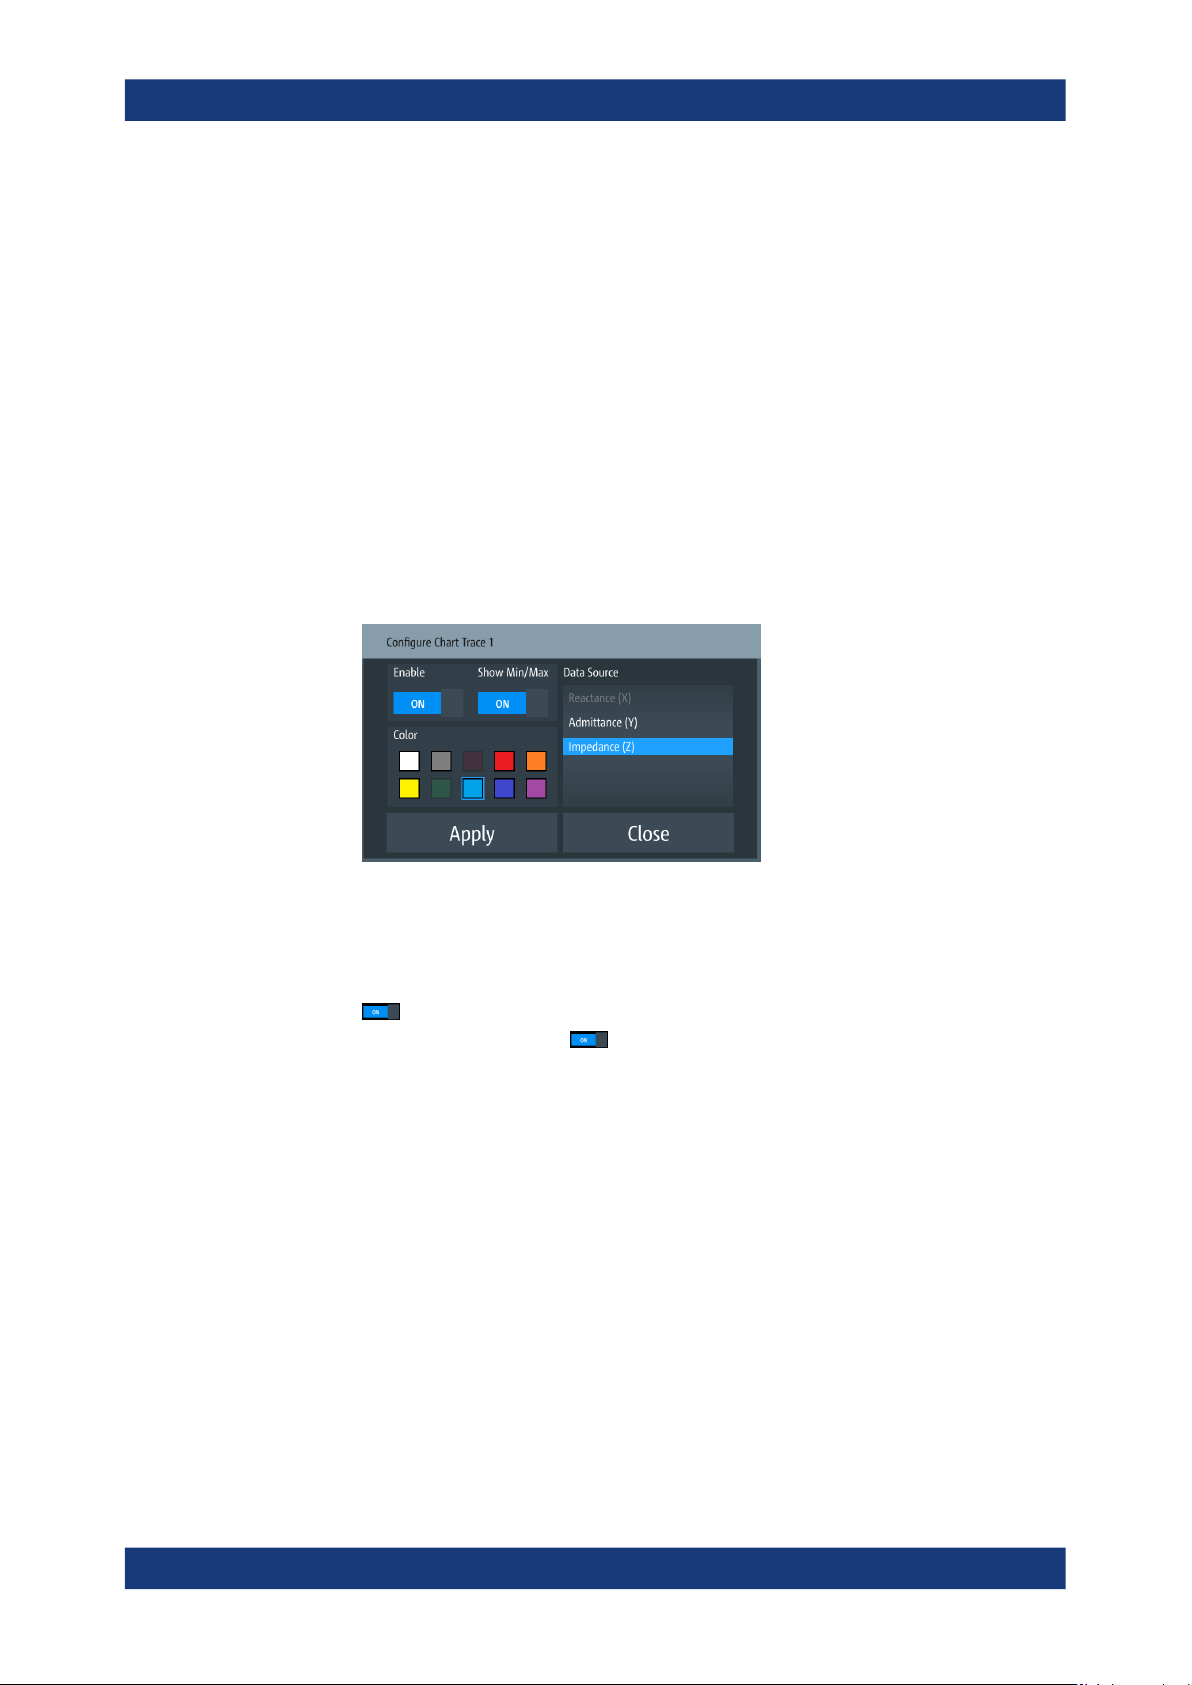
The "Configure Chart Trace <n>" dialog opens.
Figure 8-14: Configure chart trace dialog
b) In the "Data Source" list, select the parameter, e.g. "Impedance (Z)".
c) Select a color for the parameter trace.
d) To show the minimum and maximum readings of the selected parameter, turn
"Show Min/Max".
e)
To show the trace, turn "Enable".
f) Confirm with "Apply".
4. Repeat step 3 to assign additional traces, e.g. to display the readings of the reac-
tance and phase angle.
5. Select an appropriate time scaling using the "+/-" magnifiers in the "nn s/div" soft-
key.
6. Select "Clear" to restart the trace display.
The graph shows the traces of the measured values for the selected parameters. If
enabled, the chart assigns the measured minimum and maximum readings to the
trace of the parameter and displays the values numerically.
Specific instrument functions