YSi-SP_Ope_E.pdf - 第60页
2-23 2 Operation No Name Description of displayed item and functions 1 PCB (inspection program) list A list of registered PCBs (inspection programs) is displayed. Select the PCB to be inspected. 2 [ ➡ ]/[ ➡ ] button Y ou…
2-22
2
Operation
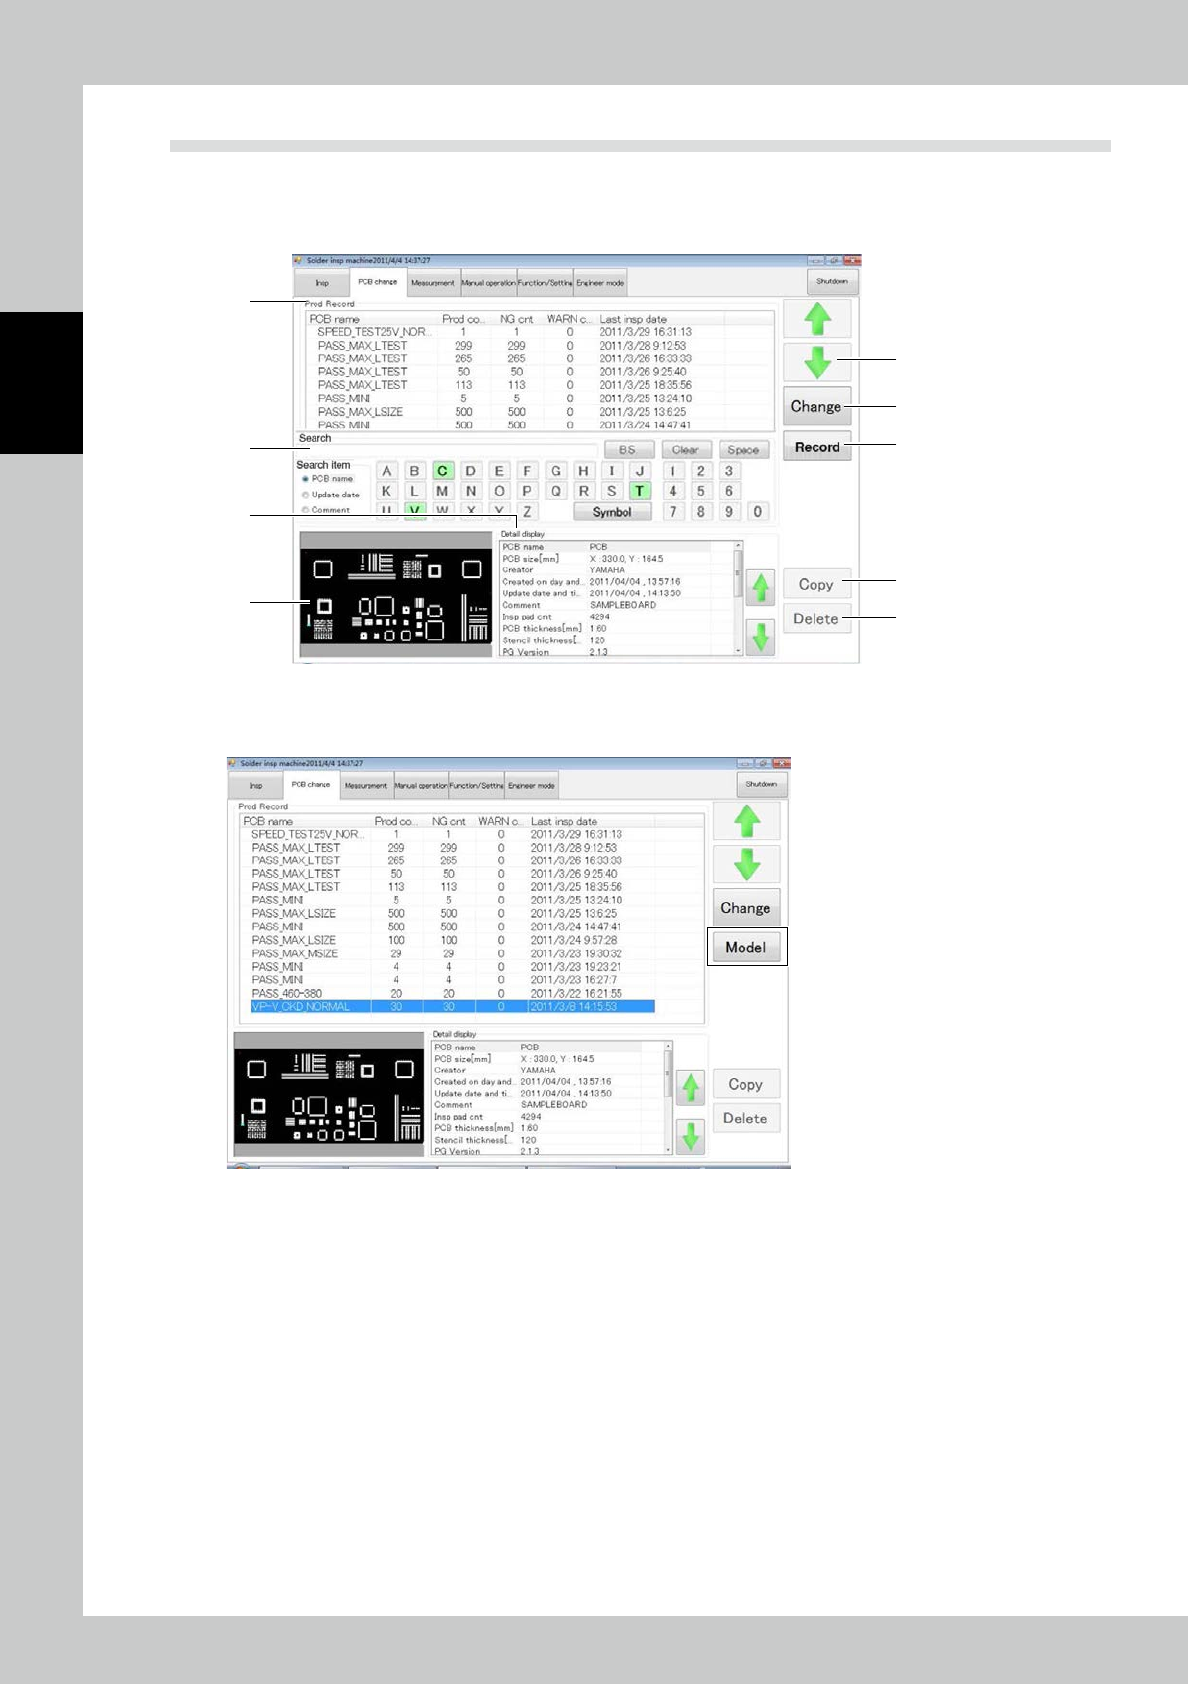
3.3 PCB Change
Items displayed on the PCB change screen and functions are described. The PCB list is displayed at the top of
the screen. Select the desired one. Or you can use arrow buttons or search function to select. After selecting
the desired PCB, touch the [Change] button.
1
3
5
9
8
6
7
4
2
24223-KMN-00
Press the [Record] button. The screen shown below is displayed. Press the [Model] button to change back to
the [Record] button and return to the original selection screen.
24224-KMN-00
2-23
2
Operation
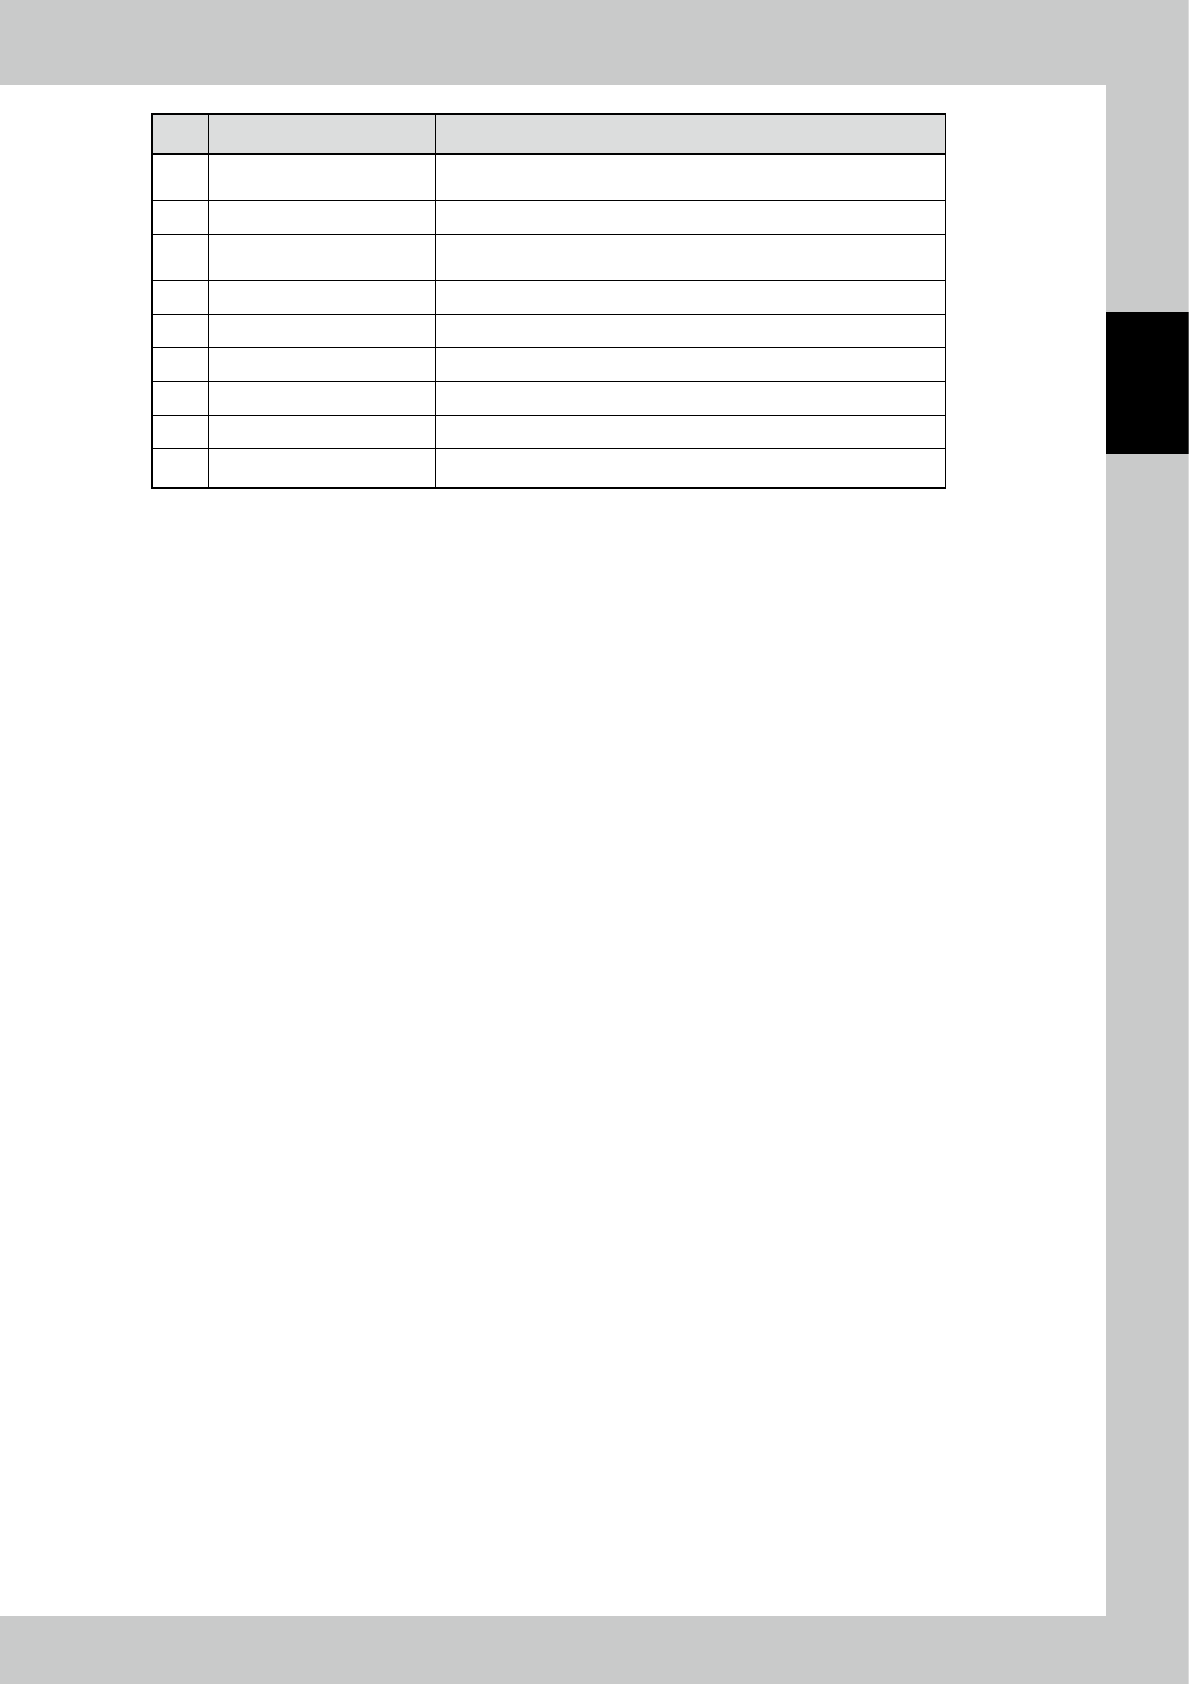
No Name Description of displayed item and functions
1 PCB (inspection program) list
A list of registered PCBs (inspection programs) is displayed. Select the
PCB to be inspected.
2 [
➡
]/[
➡
] button You can use arrow buttons to move the cursor to select.
3 Search function
You can touch the letter or number button, which corresponds to the
first character of the PCB name, at the touch panel to search.
4 Detail data The detail data about the selected PCB is displayed.
5 Preview A preview of the selected PCB is displayed.
6 [Change] button After selecting the desired PCB, touch this button.
7 [Record] button A program can be selected from the production record.
8 [Copy] button Create a copy of the selected inspection program.
9 [Delete] button Delete the selected program.
2-24
2
Operation
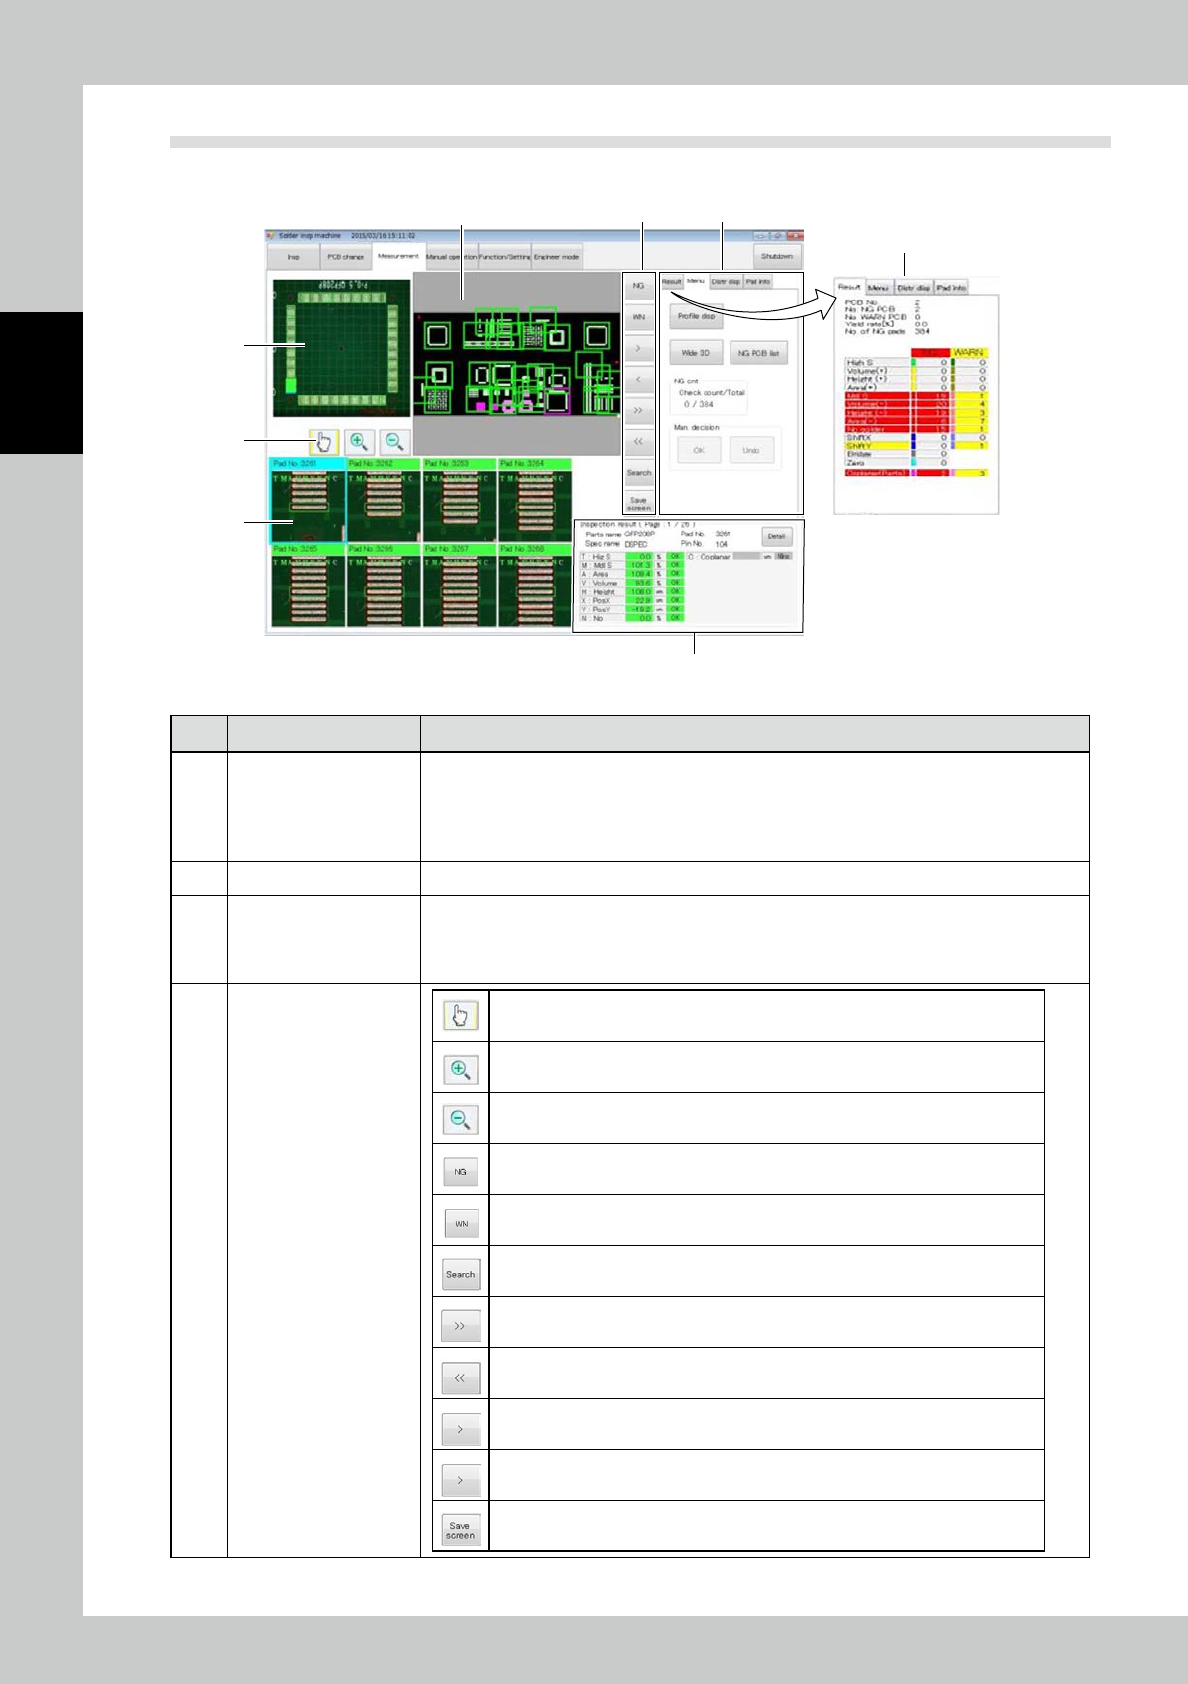
3.4 Measurement
Items displayed on the measurement screen and functions are described.
6
5
4
1
4
2
3
When “Result” is selected
24225-KMN-00
No Name Description of displayed item and functions
1 Image of PCB
The image of the entire PCB is displayed.
The field of view is indicated with a blue frame, while the selected field of view is indicated with
a pink frame.
In addition, parts judged to be faulty and those judged to call for attention are displayed in the
corresponding colors having been defined in the PCB data.
2 Image of field of view The image of the field of view selected in the entire PCB image is displayed.
3 Pad image
Eight pads in the selected field of view are displayed.
Pad of the currently selected is displayed in the specified color settings. (Section 3.6 display-
related reference). Parts judged to be faulty and those judged to call for attention are displayed
in the corresponding colors having been defined in the PCB data.
4 Edit buttons
Use to select the field of view from image 1.
Use the button to select a pad in image 1.
Use the button to zoom in images 1 and 2.
Use the button to zoom out images 1 and 2.
The parts judged to be faulty are displayed. Faulty parts blink in red in image 2,
while only faulty parts are displayed in image 3.
The parts judged to call for attention are displayed. Warning parts blink in red in
image 2, while only warning parts are displayed in image 3.
Enter a pad number to display the corresponding pad.
Move to the next field of view.
Move to the previous field of view.
A pad later than the selected one by the pad number in image 3 is selected.
A pad earlier than the selected one by the pad number in image 3 is selected.
Save the current screen in an image file.