2OM-1733-005w_F8.pdf - 第249页
2OM-1733 4-3-1 1 3.3 "EdrMng." T ab Sheet [5] [6] [7] [2] [1] [3] [4] [8] [9] [16] [17] [18] [12] [11] [10] [15] [14] [13] Fig. 2D3-8 "EdrMng." Tab Sheet 1212-002 3.3 "EdrMng." T ab Sheet
2OM-1733
4-3-10
[16]
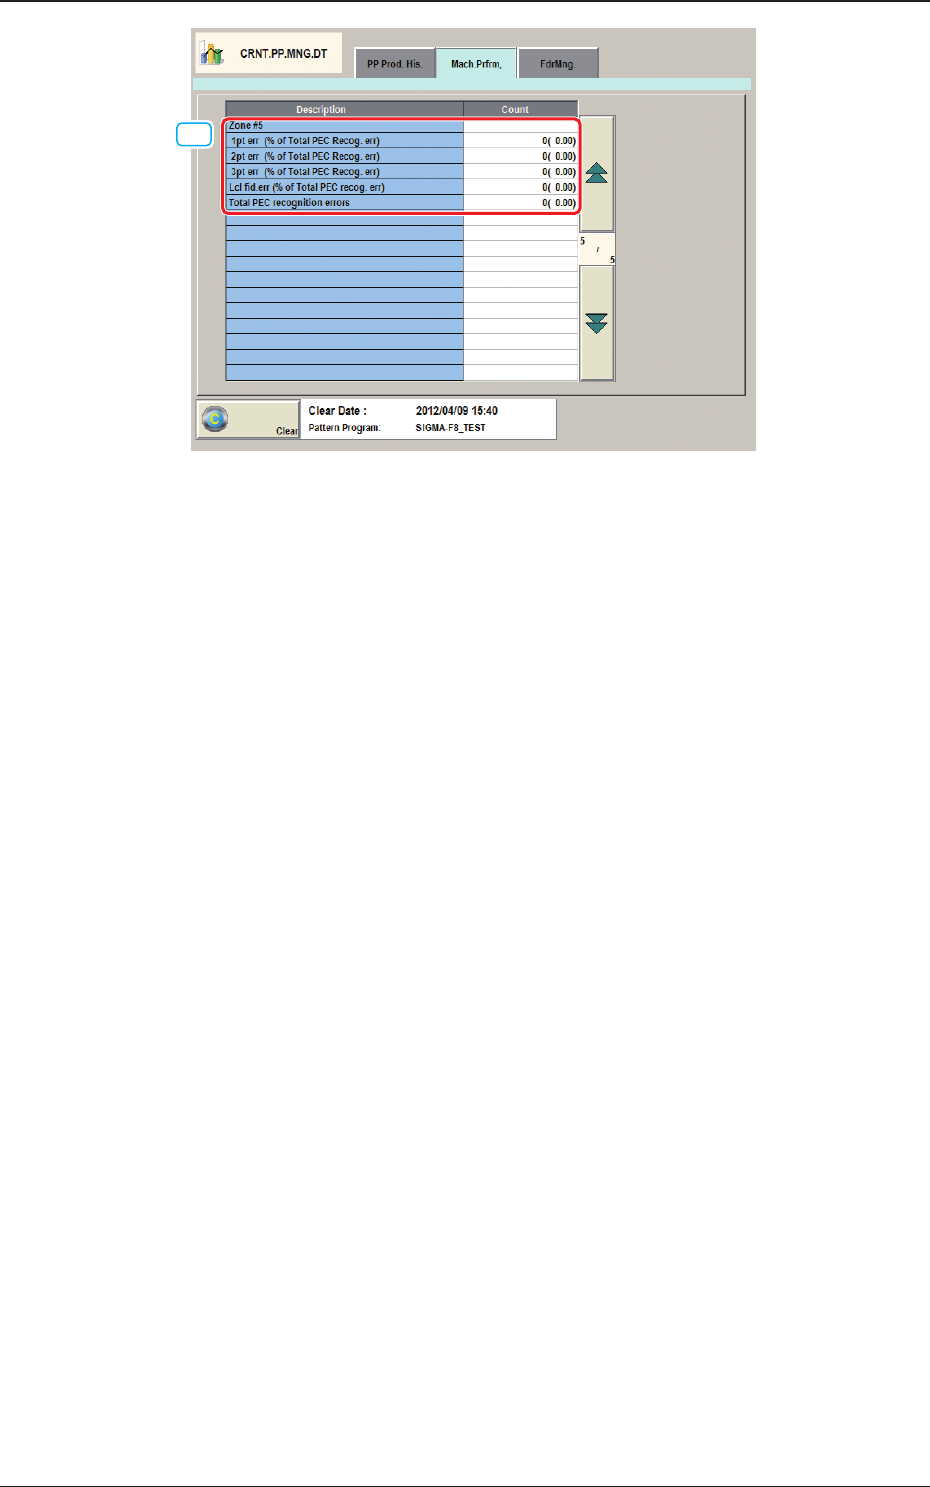
F2D3-7 "Mach.Prfrm," Tab Sheet (5/5)
[16] Zones #1 to #5
1pt err (% of Total PEC Recog. err)
Shown are the total number of errors detected on the rst ducial mark and
the percentage of the detected errors per total number of all errors detected
by the PEC recognition function.
2pt err (% of Total PEC Recog. err)
Shown are the total number of errors detected on the second ducial mark
and the percentage of the detected errors per total number of all errors
detected by the PEC recognition function.
3pt err (% of Total PEC Recog. err)
Shown are the total number of errors detected on the third ducial mark and
the percentage of the detected errors per total number of all errors detected
by the PEC recognition function.
Lcl
d.err(%ofTotalPECrecog.err)
Shown are the total number of recognition errors in each unit PCB and the
percentage of the detected errors per total number of all errors detected by
the PEC recognition function.
Total PEC recognition errors
Shown is the total number of errors detected by the PEC recognition
function.
The number of errors detected by the global PEC recognition function and
the total number of errors detected by the BBR recognition function are
displayed.
1212-002
3.2 "Mach.Prfrm," Tab Sheet
2OM-1733
4-3-11
3.3 "EdrMng." Tab Sheet
[5] [6] [7][2][1] [3] [4]
[8] [9]
[16] [17]
[18]
[12][11][10]
[15][14][13]
Fig. 2D3-8 "EdrMng." Tab Sheet
1212-002
3.3 "EdrMng." Tab Sheet

2OM-1733
4-3-12
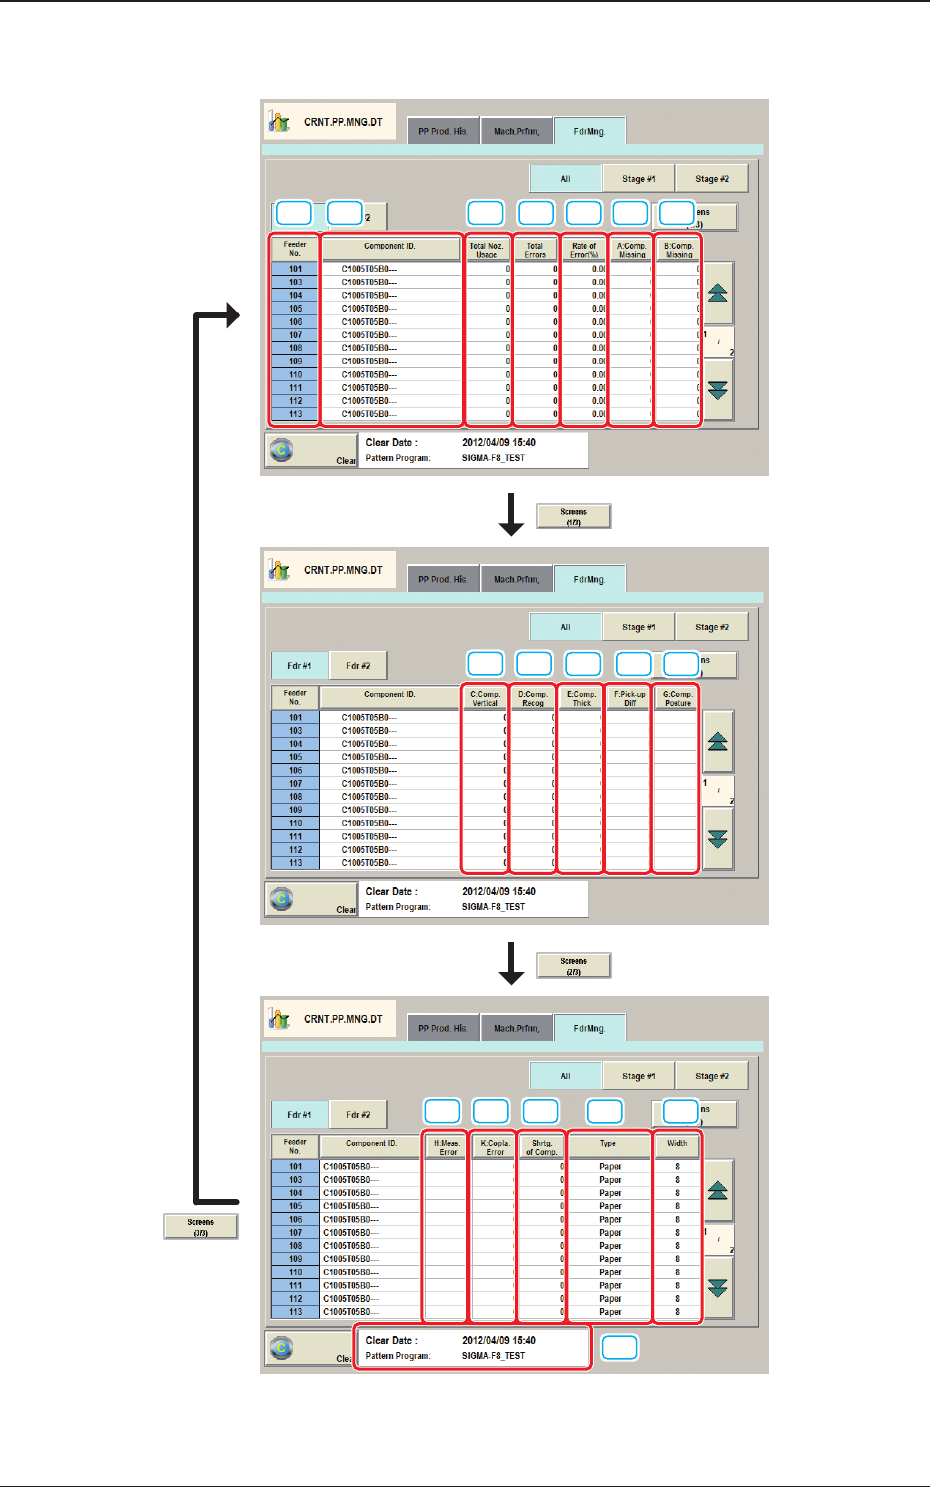
Note
(a) The displayed tab sheet will look different, depending on which option is
selected.
(b) Each item box functions as a button and each pressing of the buttons can
list the data parameters in descending order. The top box shows the largest
value for error times. Therefore, it is useful for the analysis to enhance the
operation rate. When the [Feeder No.] button is pressed, the Nos. are re-
arranged in their initial order (Feeder Nos.).
The "EdrMng." tab sheet is divided further into several tabs and each tab sheet
shows the handling errors per feeder on each individual feeder bases.
When each tab is pressed, the corresponding tab sheet appears.
[1] Feeder No.
Shown are the feeder Nos.
[2] Component ID.
Each text box shows the set component ID.
[3] Total Noz. Usage
Each text box shows the total number of picked components (number of
pickup actions) for each individual feeders.
[4] Total Errors
Each text box shows the total number of errors detected in [5] through [13].
[5] Rate of Error [%]
Each text box shows the percentage of the total number of errors per the
number of picked components.
[6] A:Comp. Missing
Each text box shows the total number of missing components detected by the
linear measure detection sensor for each individual feeders.
[7] B:Comp. Missing
Each text box shows the total number of missing components detected
through recognition operation for each individual feeders.
[8] C:Comp. Vertical
Each text box shows the total number of vertical component errors detected
by the linear measure detection sensor for each individual feeders.
[9] D:Comp. Recog.
Each text box shows the total number of errors detected through recognition
operation for each individual feeders.
1205-001
3.3 "EdrMng." Tab Sheet