3OM-1003-005.pdf - 第245页
3 .4 "Handling Errors Per Feeder" T ab The corresponding tab sheet enables the operator to view the handling errors on each individual feeders. • Sheet Layout When the "Handling Errors Per Feeder" tab…
3.3 "Sub-System Error Counts" Tab
The corresponding tab sheet enables the operator to view the total num-
ber of errors that occurred on each device during automatic operation.
• Sheet Layout
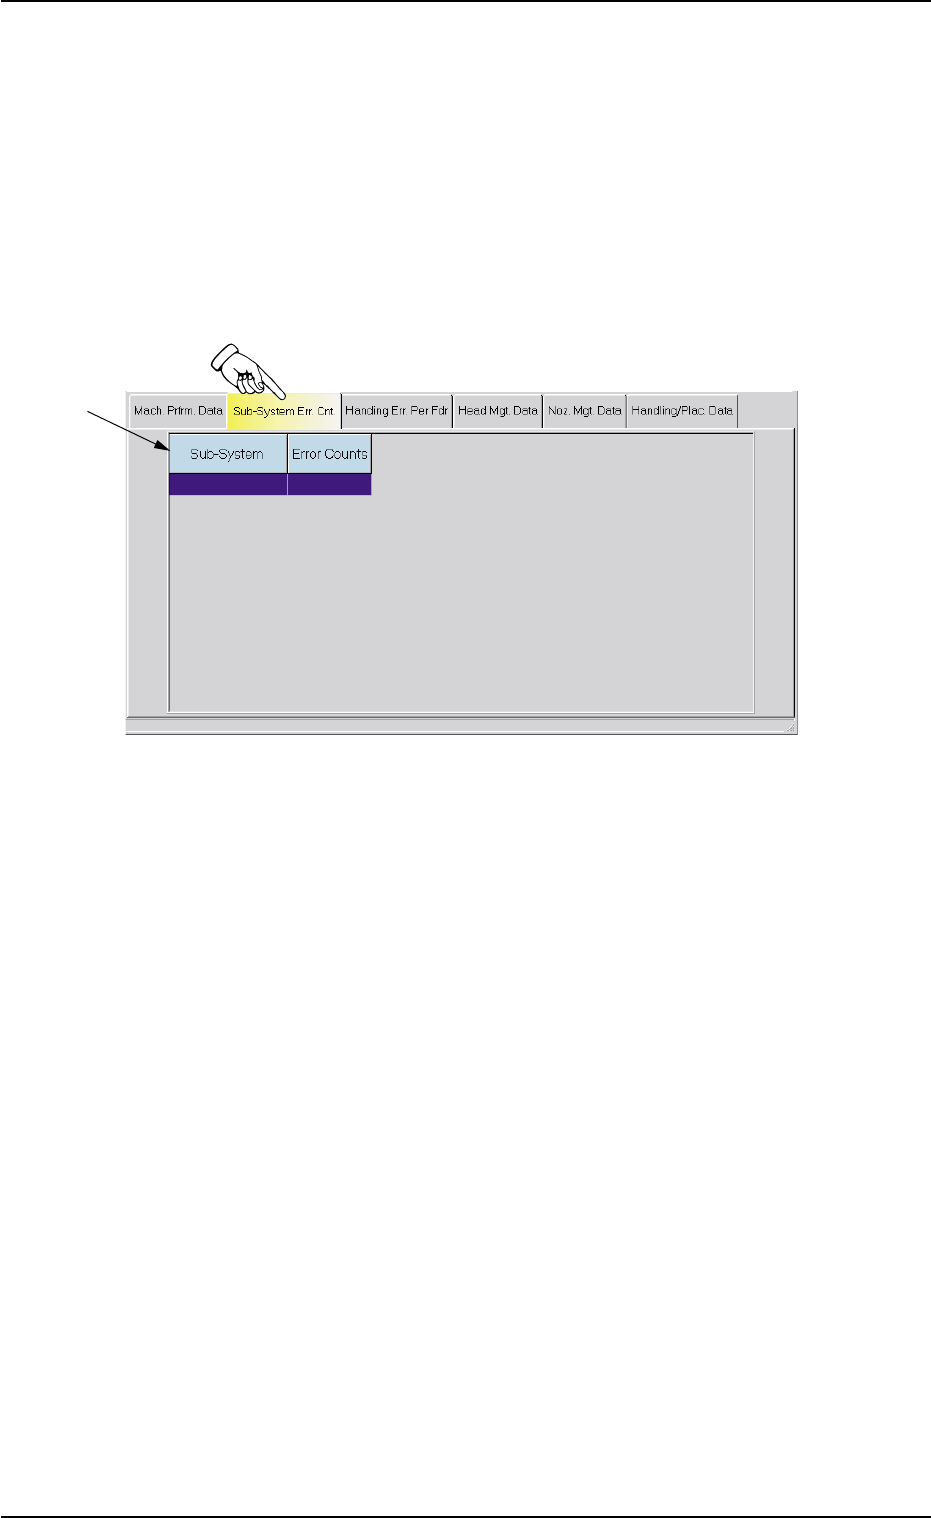
When the"Sub-System Error Counts" tab is pressed in the "Manage-
ment Data" window, the following tab sheet appears inside the window.
Fig. 3D10 "Sub-System Error Counts" Tab Sheet
• Sheet Composition
*1 Items
The following items are displayed.
(1) Sub-System
Shown is the device on which an error occurred.
(2) Error Counts
Shown is the total number of errors that occurred on the device.
• How to view the details
When the device line is pressed to view the details, the "Details" win-
dow opens.
The "Details" window displays the number of errors that have oc-
curred in each error-caused spot of the selected device.
When the [OK] button is pressed in the "Details" window, the "De-
tails" window closes.
*1
3.3 "Sub-System Error Counts" Tab
0305-001 4-20 AIL01EDTP
3.4 "Handling Errors Per Feeder" Tab
The corresponding tab sheet enables the operator to view the handling
errors on each individual feeders.
• Sheet Layout
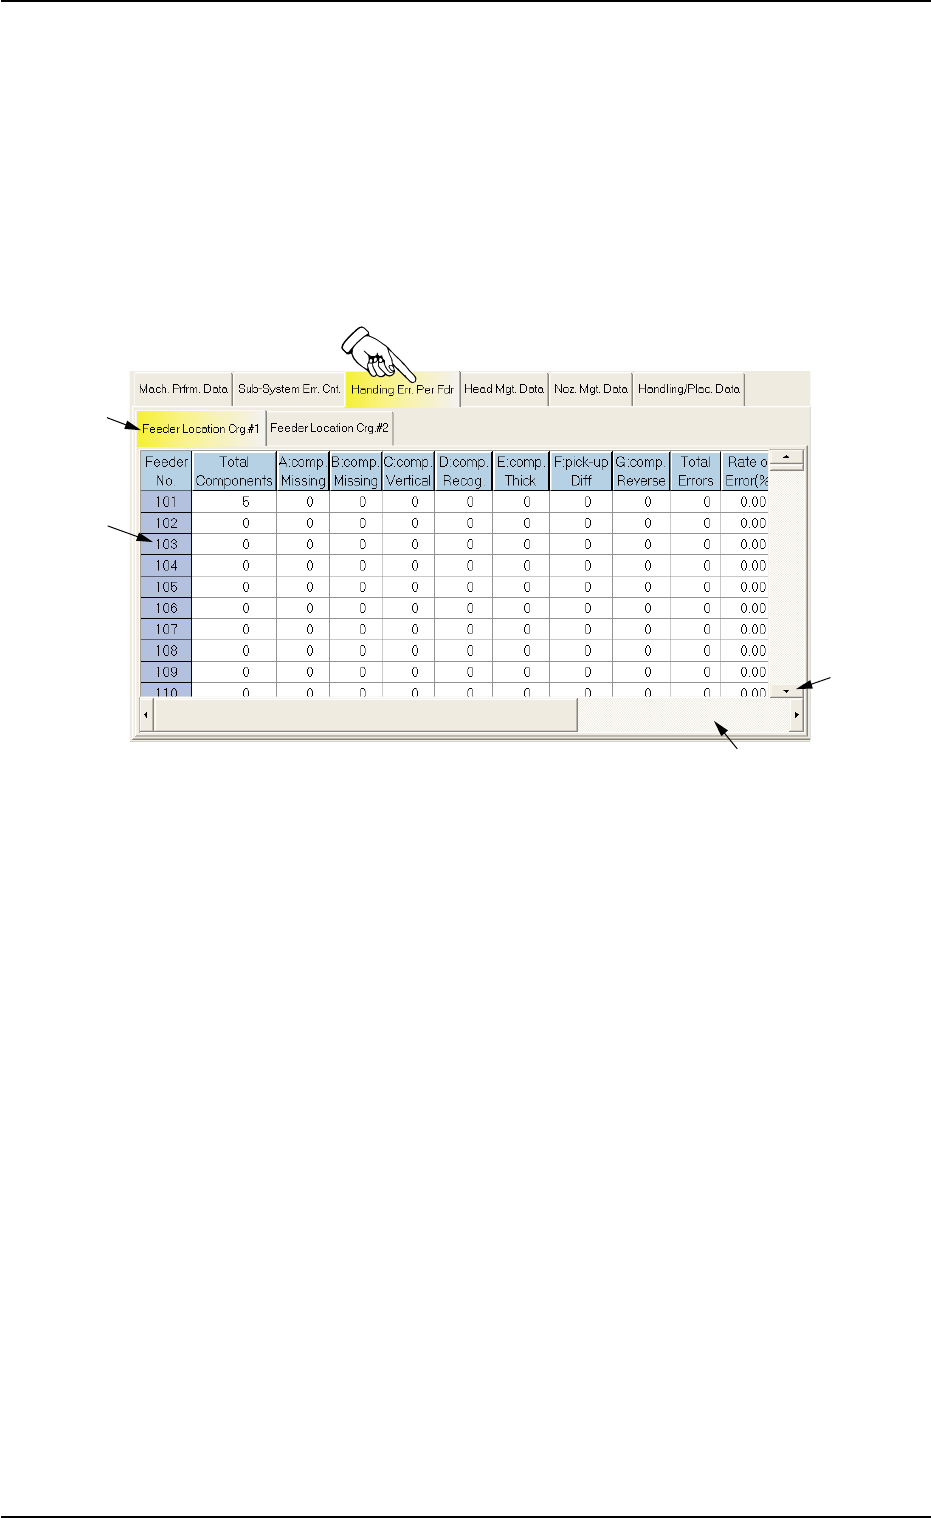
When the "Handling Errors Per Feeder" tab is pressed in the "Manage-
ment Data" window, the following tab sheet appears inside the window.
Fig. 3D11 "Handling Errors Per Feeder" Tab Sheet
• Sheet Composition
*1 "Feeder Location Crg. #1 and #2" Tabs
The "Handling Errors Per Feeder" tab sheet is divided further into
four tab sheets and each tab sheet shows the handling errors per
feeder on each individual feeder carriages.
When a tab is pressed, the corresponding tab sheet appears, indi-
cating that the related feeder carriage is selected.
*2 Items
The following items are displayed.
(1) [Feeder No.] Button
Shown are the feeder Nos.
(2) [Total Components] Button
Each text box shows the total number of picked components (num-
ber of pick-up actions) for each individual feeders.
*1
*3
*2
*4
3.4 "Handling Errors Per Feeder" Tab
0403-002 4-21 AIL01EDTP

(3) [A: comp. Missing] Button
Each text box shows the total number of missing components
detected by the linear measure detection sensor for each indi-
vidual feeders.
(4) [B: comp. Missing] Button
Each text box shows the total number of missing components
detected through recognition operation for each individual feed-
ers.
(5) [C: comp. Vertical] Button
Each text box shows the total number of vertical components
detected by the linear measure detection sensor for each indi-
vidual feeders.
(6) [D: comp. Recog.] Button
Each text box shows the total number of errors detected through
recognition operation for each individual feeders.
(7) [E: comp. Thick] Button
Each text box shows the total number of errors in component
thickness detected by the linear measure detection sensor for
each individual feeders.
(8) [F: pick-up Diff] Button
Each text box shows the total number of pick-up difference er-
rors detected through recognition operation for each individual
feeders.
(9) [G: comp. Reverse] Button
Each text box shows the total number of reversed component
errors detected through recognition operation for each individual
feeders.
(10) [Total Errors] Button
Each text box shows the total number of errors detected in (3)
through (9).
(11) [Rate of Error (%)] Button
Each text box shows the percentage of the total number of errors
per the number of picked components.
3.4 "Handling Errors Per Feeder" Tab
0305-001 4-22 AIL01EDTP