3OM-1003-005.pdf - 第248页
3 .5 "Head Management Data" T ab The corresponding tab sheet enables the operator to view the head management data for each individual heads. • Sheet Layout When the "Head Management Data" tab is pres…

(12) [Shrtg. of Comp.] Button
Each text box shows the total number of component shortage
errors detected for each individual feeders.
(13) Component backtrack
Shown is the total number of component backtrack errors for each
individual feeders.
(14) Component output error (Pickup error)
Shown is the total number of the output-error-caused compo-
nents (pickup errors) for each individual feeders.
(15) Component output error (Others)
Shown is the total number of the output-error-caused compo-
nents (errors other than pickup ones) for each individual feeders.
When one of the above buttons is pressed, the feeder No. with
the biggest parameter under the selected button is displayed in
the first line and feeder Nos. having the subsequent (second,
third, fourth, ...) biggest parameters follow. That is, parameters
are re-arranged in order of error counts (from the biggest to the
smallest ones), making it easy to analyze and improve produc-
tion rate.
When the [Feeder No.] button is pressed, feeder Nos. are ar-
ranged in their initial order (order of slot Nos.).
*3 Vertical Scroll Bar
Up and down arrows are located at both ends of a scroll bar. The up
or the down arrow can be pressed to scroll up or down a tab sheet
to expose hidden parameters (data for the hidden feeder Nos.).
*4 Horizontal Scroll Bar
Right and left arrows are located at both ends of a scroll bar. The
right or the left arrow can be pressed to scroll right or left a tab sheet
to expose hidden parameters.
3.4 "Handling Errors Per Feeder" Tab
0403-002 4-23 AIL01EDTP
Note
3.5 "Head Management Data" Tab
The corresponding tab sheet enables the operator to view the head
management data for each individual heads.
• Sheet Layout
When the "Head Management Data" tab is pressed in the "Management
Data" window, the following tab sheet appears inside the window.
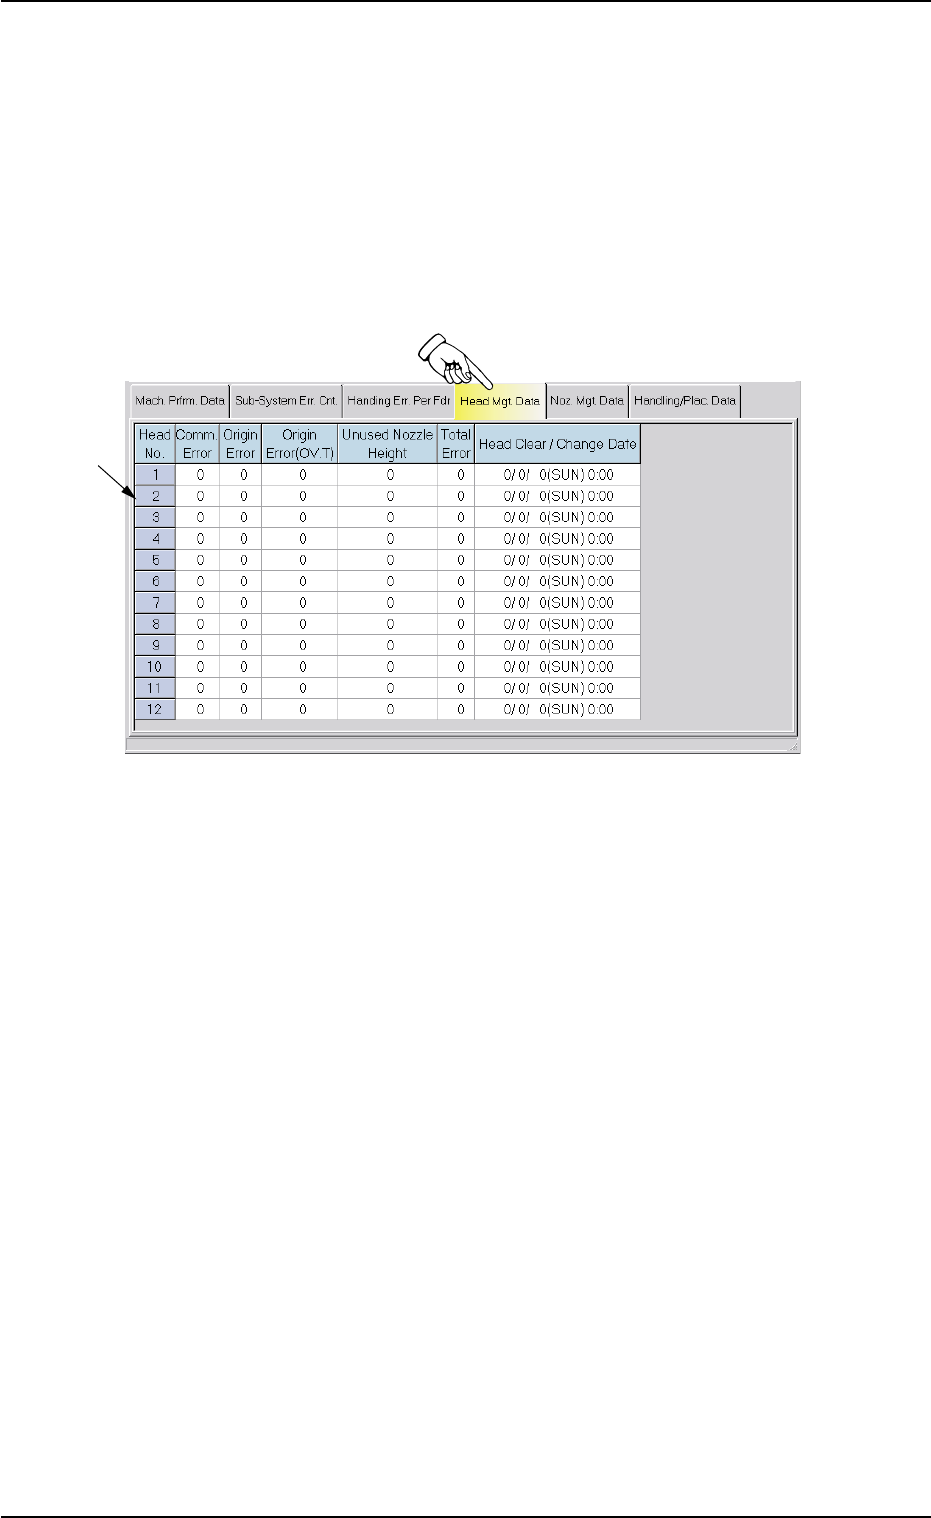
Fig. 3D12 "Head Management Data" Tab Sheet
• Sheet Composition
*1 Items
The following items are displayed.
(1) [Head No.] Button
Shown are the head Nos. (1 to 12).
(2) [Comm. Error] Button
Each text box shows the number of communication errors for
each individual heads.
(3) [Origin Error] Button
Each text box shows the number of head origin errors for each
individual heads.
(4) [Origin Error (OV. T)] Button
Each text box shows the number of errors detected while the
head was returning to its origin.
3.5 "Head Management Data" Tab
*1
0305-001 4-24 AIL01EDTP

(5) [Unused Nozzle Height] Button
Each text box shows the number of nozzle height errors (error in
height of the unused nozzle).
(6) [Total Error] Button
Each text box shows the total number of errors detected in (2)
through (5).
(7) [Head Clear/Change Date] Button
Each text box shows the clear date for each individual heads.
(based on head bypassing, etc.)
When one of the above buttons is pressed, the feeder No. with
the biggest parameter under the selected button is displayed in
the first line and feeder Nos. having the subsequent (second,
third, fourth, ...) biggest parameters follow. That is, parameters
are re-arranged in order of error counts, making it easy to ana-
lyze and improve production rate.
When the [Head No.] button is pressed, head Nos. are arranged
in their initial order (order of head Nos.).
3.5 "Head Management Data" Tab
0305-001 4-25 AIL01EDTP
Note