YSD_Users_E.pdf - 第159页
4-31 4 Making the dispensing stable n Propor tion type T he proportion type uses the following calculation formulas to calculate and correct the area. The dispensing liquid amount is then corrected based on this calculat…
4-30
4
Making the dispensing stable
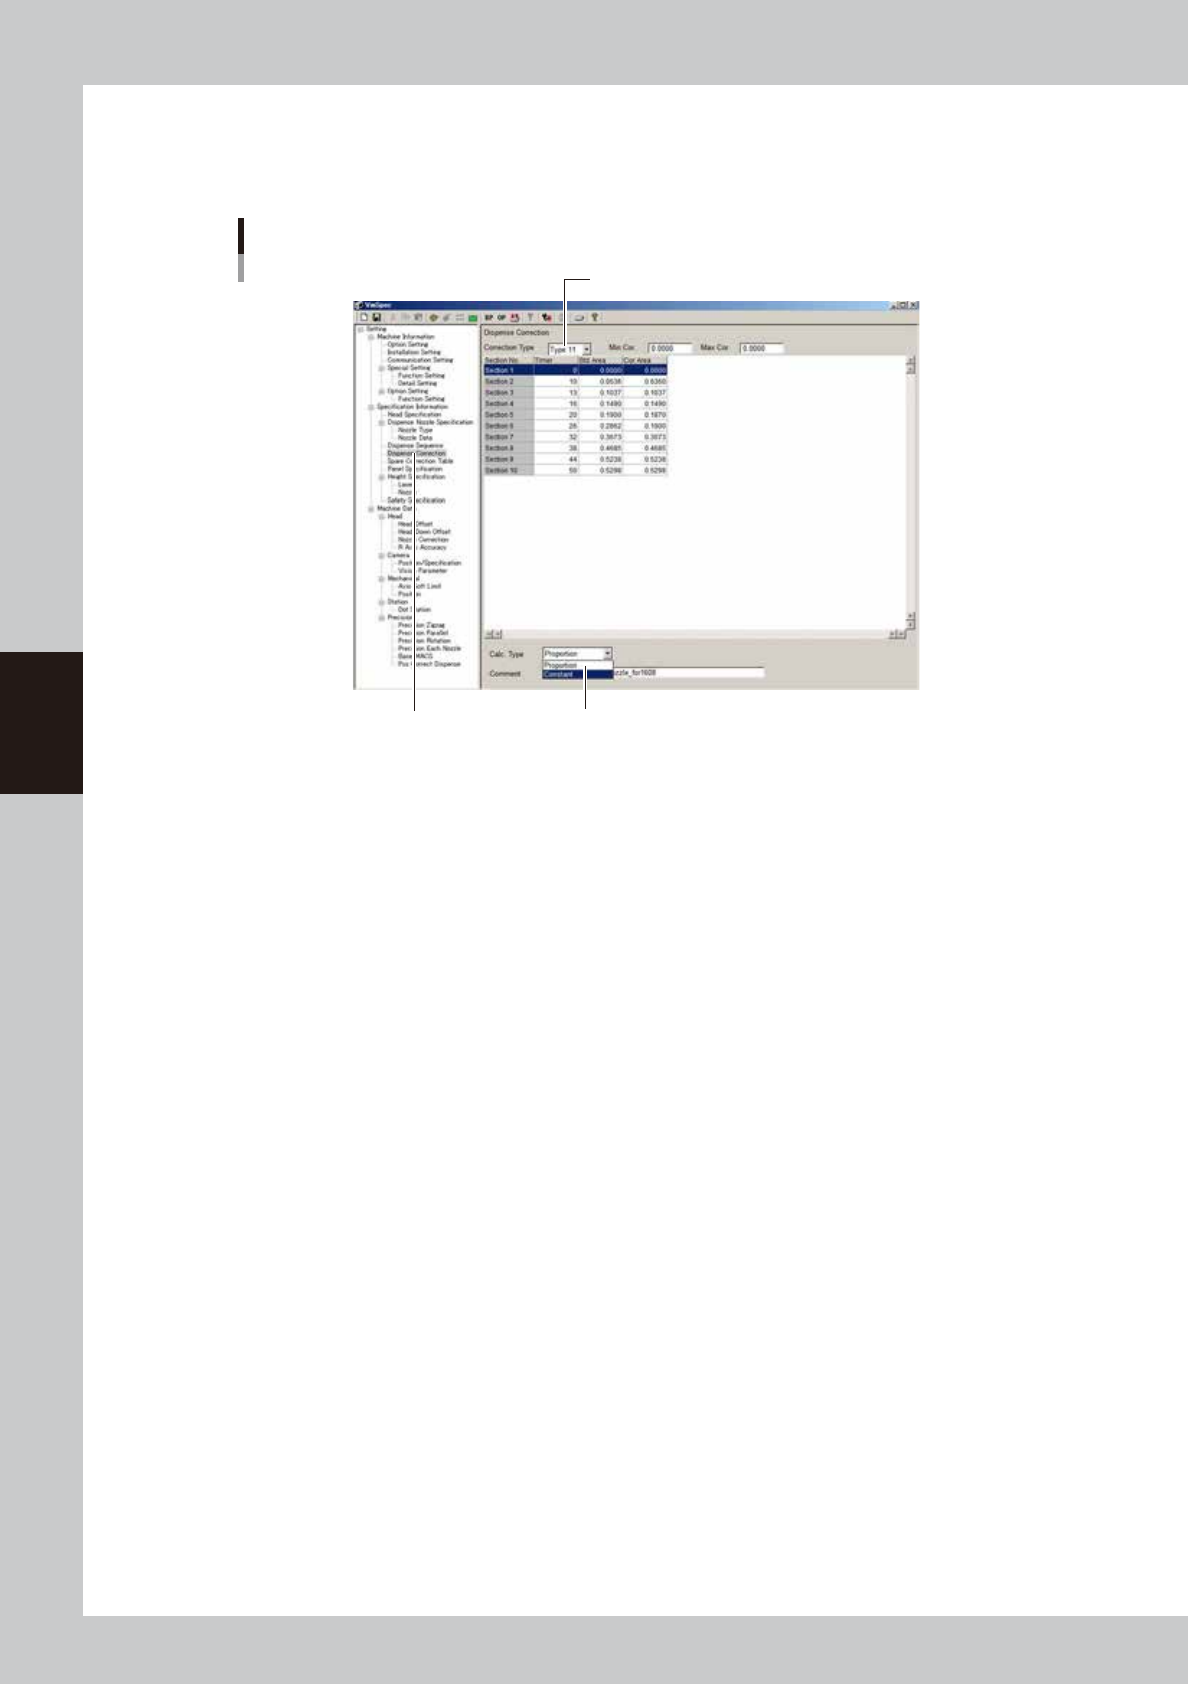
7
Set the calculation type.
Open the [Machine] - “Specification Information” - “Dispense Correction” screen, and select the
correction type and the calculation type.
”Dispense Correction” screen in VmSpec window
Select “Dispense Correction”.
Select the correction type to edit.
Select the calculation type.
64446-N7-00
4-31
4
Making the dispensing stable
n
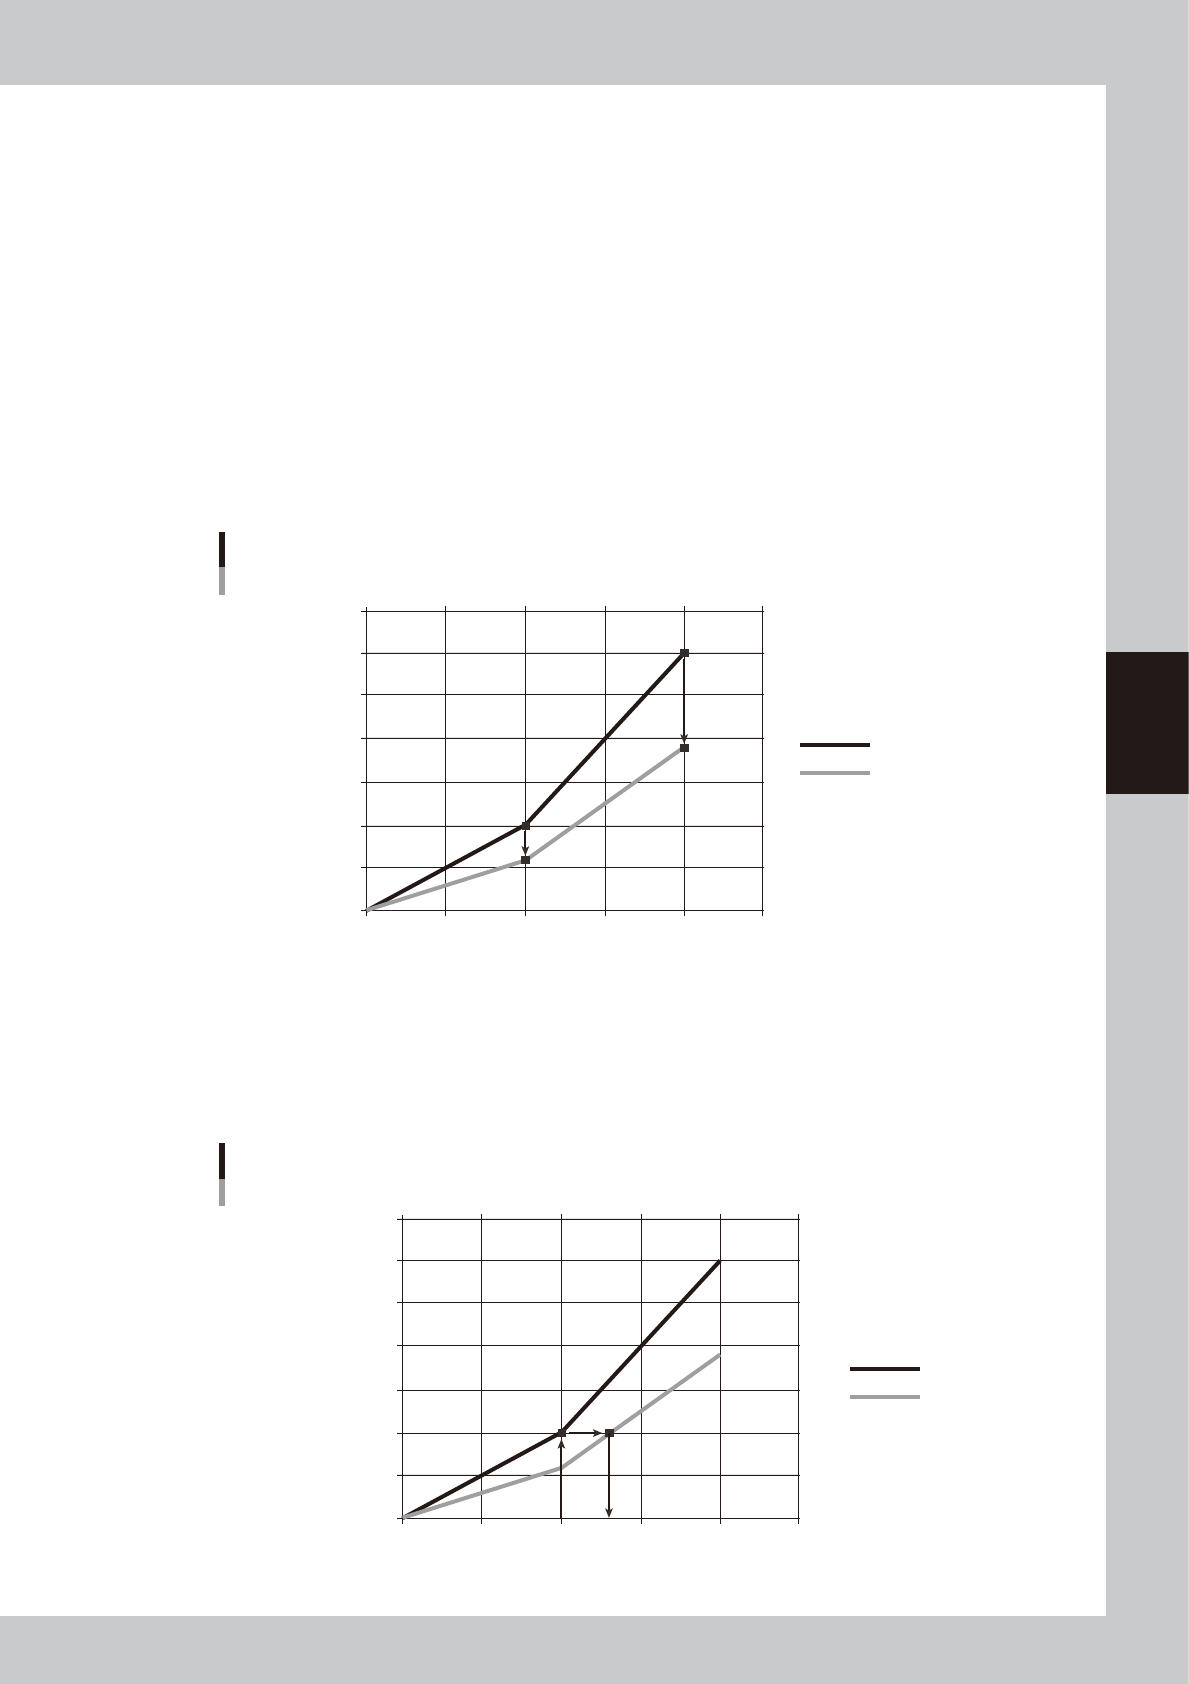
Proportion type
The proportion type uses the following calculation formulas to calculate and correct the area. The dispensing liquid
amount is then corrected based on this calculated results.
(Correction ratio) = (Area obtained by recognition) / (Standard area calculated from liquid amount used)
(Correction area) = (Standard area of table) × (Correction ratio)
Example of proportion type correction
For example, if a liquid amount of 20 is dispensed to check the dot area and the measured dot area is 0.60, then the
correction value is calculated as follows:
(Correction ratio) = (Area recognized) / (Standard area calculated from liquid amount timer used)
= 0.60 / 1.00
= 0.60
The correction ratio obtained is applied to all sections. The graph below shows the relation between the liquid amount
and the correction area.
0
0.5
1.0
1.5
2.0
2.5
3.0
3.5
0 10 20 30 40 50
Proportion type correction graph
Example
Dispensing liquid amount [msec]
Dispensed area [mm2]
Standard area
0.6 times
0.6
times
Correction area
63413-N7-00
Dispense correction is automatically performed based on the standard area and correction area.
1. Find the standard area using the same dispensing liquid amount of 20 [msec] as used for checking the dispensed area.
(=1)
2. Find the point where the graph of the area found in step 1 intersects with the graph of the correction area.
3. The liquid amount at the point found in step 2 is the correction value.
0
0.5
1.0
1.5
2.0
2.5
3.0
3.5
0 10 20 30 40 50
26.7
Correction value
Proportion type correction graph 2
Example
Dispensing liquid amount [msec]
Dispensed area [mm2]
Standard area
Correction area
1
2
3
63414-N7-00
4-32
4
Making the dispensing stable
n
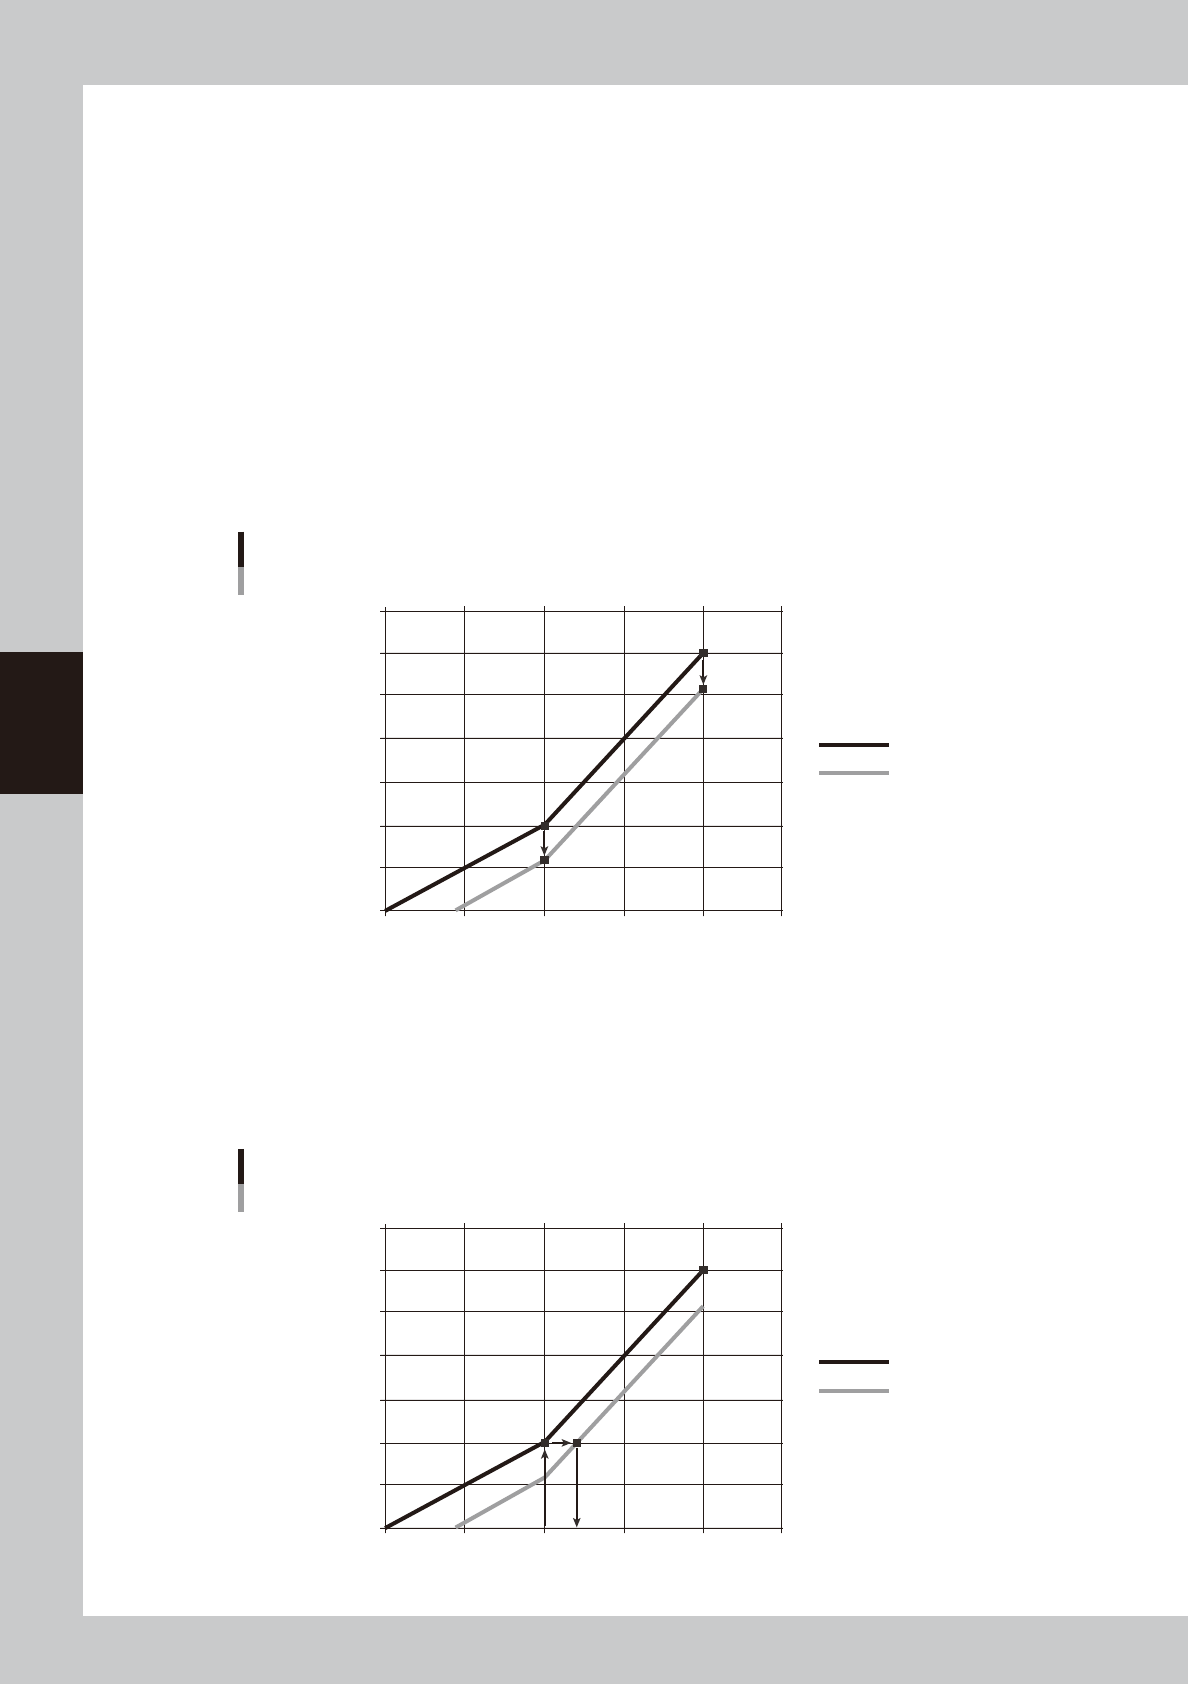
Constant type
The constant type uses the following calculation formulas to calculate and correct the area. The dispensing liquid amount
is then corrected based on this calculated results.
(Additional value) = (Area obtained by recognition) - (Standard area calculated from liquid amount used)
(Correction area) = (Standard area of table) × (Additional value)
Example of constant type correction
For example, if a liquid amount of 20 is dispensed to check the dot area and the measured dot area is 0.60, then the
correction value is calculated as follows:
(Additional value) = (Area recognized) - (Standard area calculated from liquid amount timer used)
= 0.60 – 1.00
= −0.40
The correction ratio obtained is applied to all sections. The graph below shows the relation between the liquid amount
and the correction area.
0
0.5
1.0
1.5
2.0
2.5
3.0
3.5
0 10 20 30 40 50
Constant type correction graph
Example
Dispensing liquid amount [msec]
Dispensed area [mm2]
Standard area
−0.4
−0.4
Correction area
63415-N7-00
Dispense correction is automatically performed based on the standard area and correction area.
1. Find the standard area using the same dispensing liquid amount of 20 [msec] as used for checking the dispensed area.
(=1)
2. Find the point where the graph of the area found in step 1 intersects with the graph of the correction area.
3. The liquid amount at the point found in step 2 is the correction value.
0
0.5
1.0
1.5
2.0
2.5
3.0
3.5
0 10 20 30 40 50
Constant type correction graph 2
Example
Dispensing liquid amount [msec]
Dispensed area [mm2]
Standard area
Correction area
24
Correction value
1
2
3
63416-N7-00