VI User Manual.pdf - 第184页
Tools library 7 - 22 Vision 2007 4.10 User Manual Re v 01 7.4.2.2 Edge test Click on Test ( A ) button to apply all the inspection pa - rameters to the model. Score ( B ): score of the test- ed tool (rate of detectio n s…
Tools library
Vision 2007 4.10 User Manual Rev 01 7 - 21
• The Tolerance (mm) (G) of the expected width between 2 transitions.
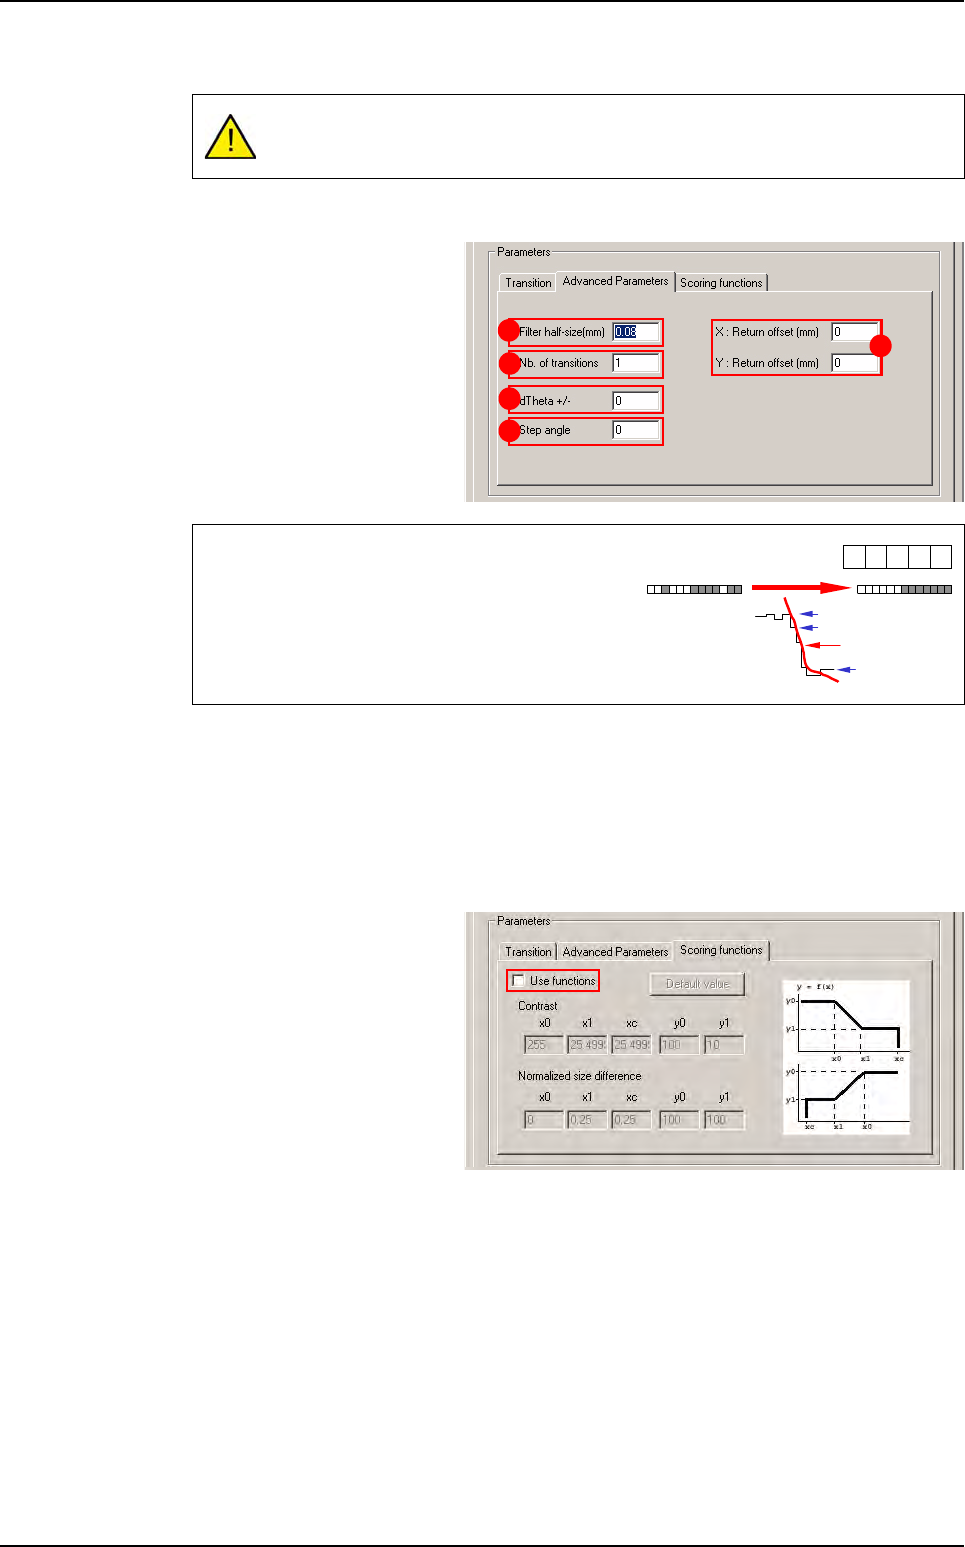
Advanced parameters tab
Filter half-size (mm)
(
A
): filter
size in microns. The sharper
the transition (short distance),
the smaller the filter, and vice
versa.
Nb of transitions
(
B
): defined number of objects that you are looking for in the treatment area.
XY: Return offset (mm) (C): X & Y offset position.
dTheta +/- (D): search angle of the treatment window.
Step angle (E): search angle step.
Scoring functions tab
Tick Use functions to adjust
Contrast and Normalized
size difference parameters
A zero value for Tolerance is not accepted and will generate many errors as
pixel size is different from
ε
0
.
The filter function enables you to:
• Regularize the gray levels and therefore avoid
detection of transitions due to image grain limit.
• Make a transition gradient.
A
B
D
E
C
-1 0
1
240
239
40
Filter result
1
-1
Edge
Tools library
7 - 22 Vision 2007 4.10 User Manual Rev 01
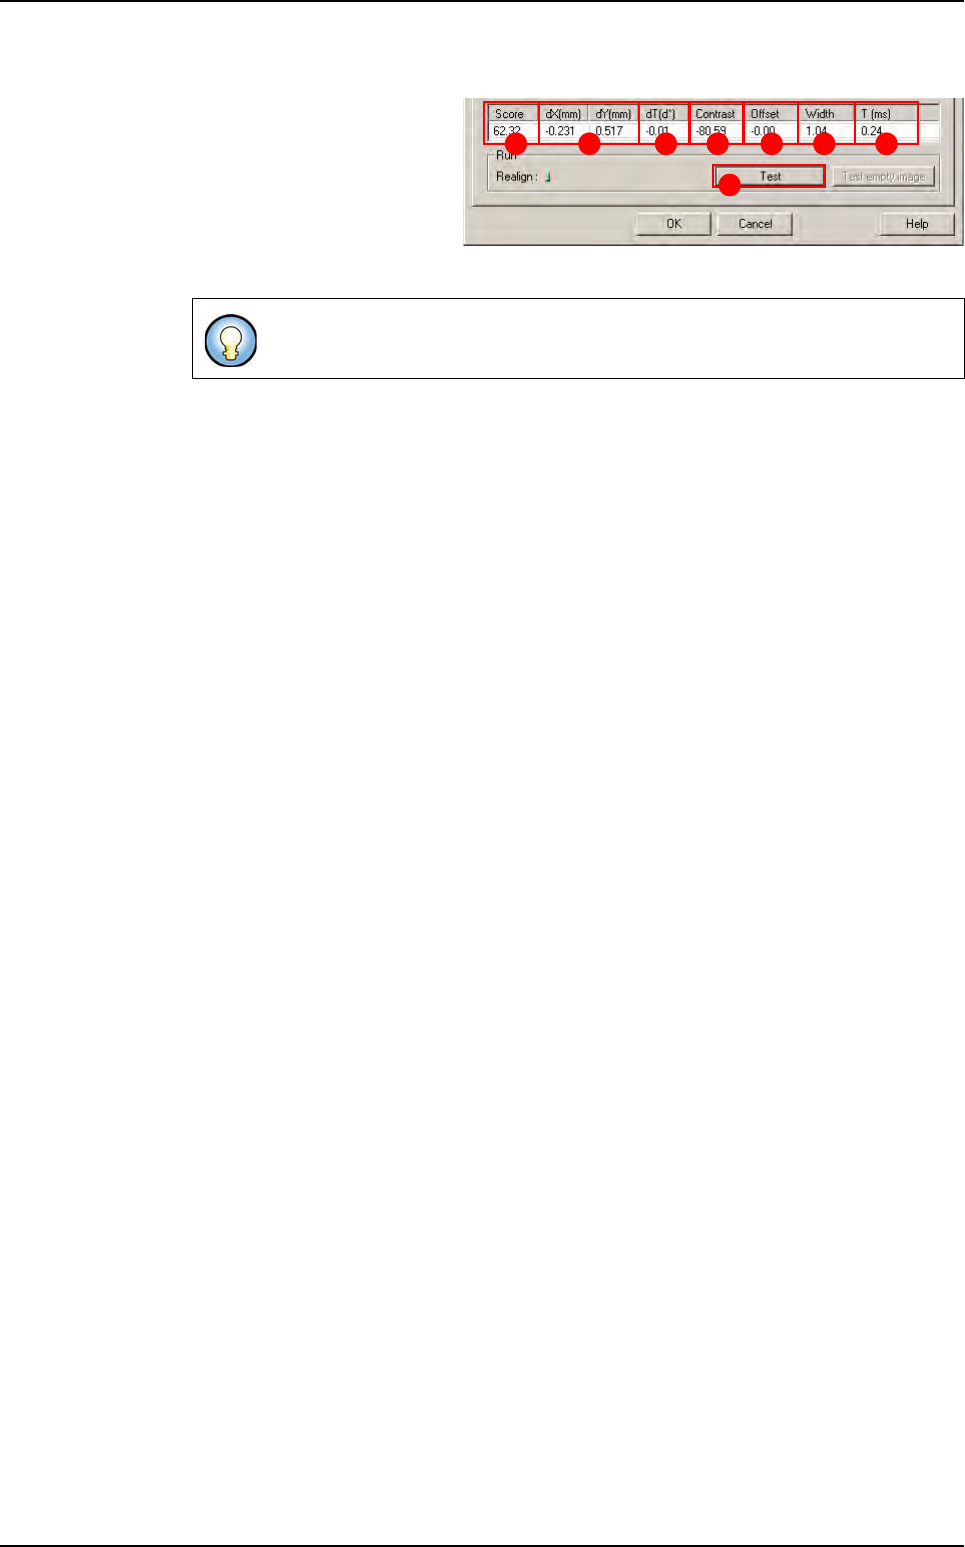
7.4.2.2 Edge test
Click on Test (A) button to
apply all the inspection pa-
rameters to the model.
Score (B): score of the test-
ed tool (rate of detection suc-
cess).
dXY(mm)
(
C
): position in X and Y between the transitions (center between the 2 transitions).
dT(d°) (D): position result in theta of the tested model.
Contrast (E): difference of a transition, in gray level values between background bright-
ness and component brightness. This value is the average of the transition contrast
found during the test.
Offset (F):
Width (G): width between the transitions found.
T (ms) (H): inspection time.
If only one transition is looked for, this is the position of the transition found.
A
B C D E F G H
Edge
Tools library
Vision 2007 4.10 User Manual Rev 01 7 - 23
7.5 Histogram
The Histogram tool enables measurement of the brightness in a pre-
defined window (average gray level of the pixel population). It is mainly
used for the presence / absence of the component body, the weld
seam and for component polarity.
7.5.1 Model description tab
1. On the Model description tab, in the Edit a model window, choose the treatment operation:
a new Histogram tab appears behind the Model description tab.
2. Click on Edit area button to place the model encompassing area exactly on the image.
This histogram sends back no position values in X, Y or angle.
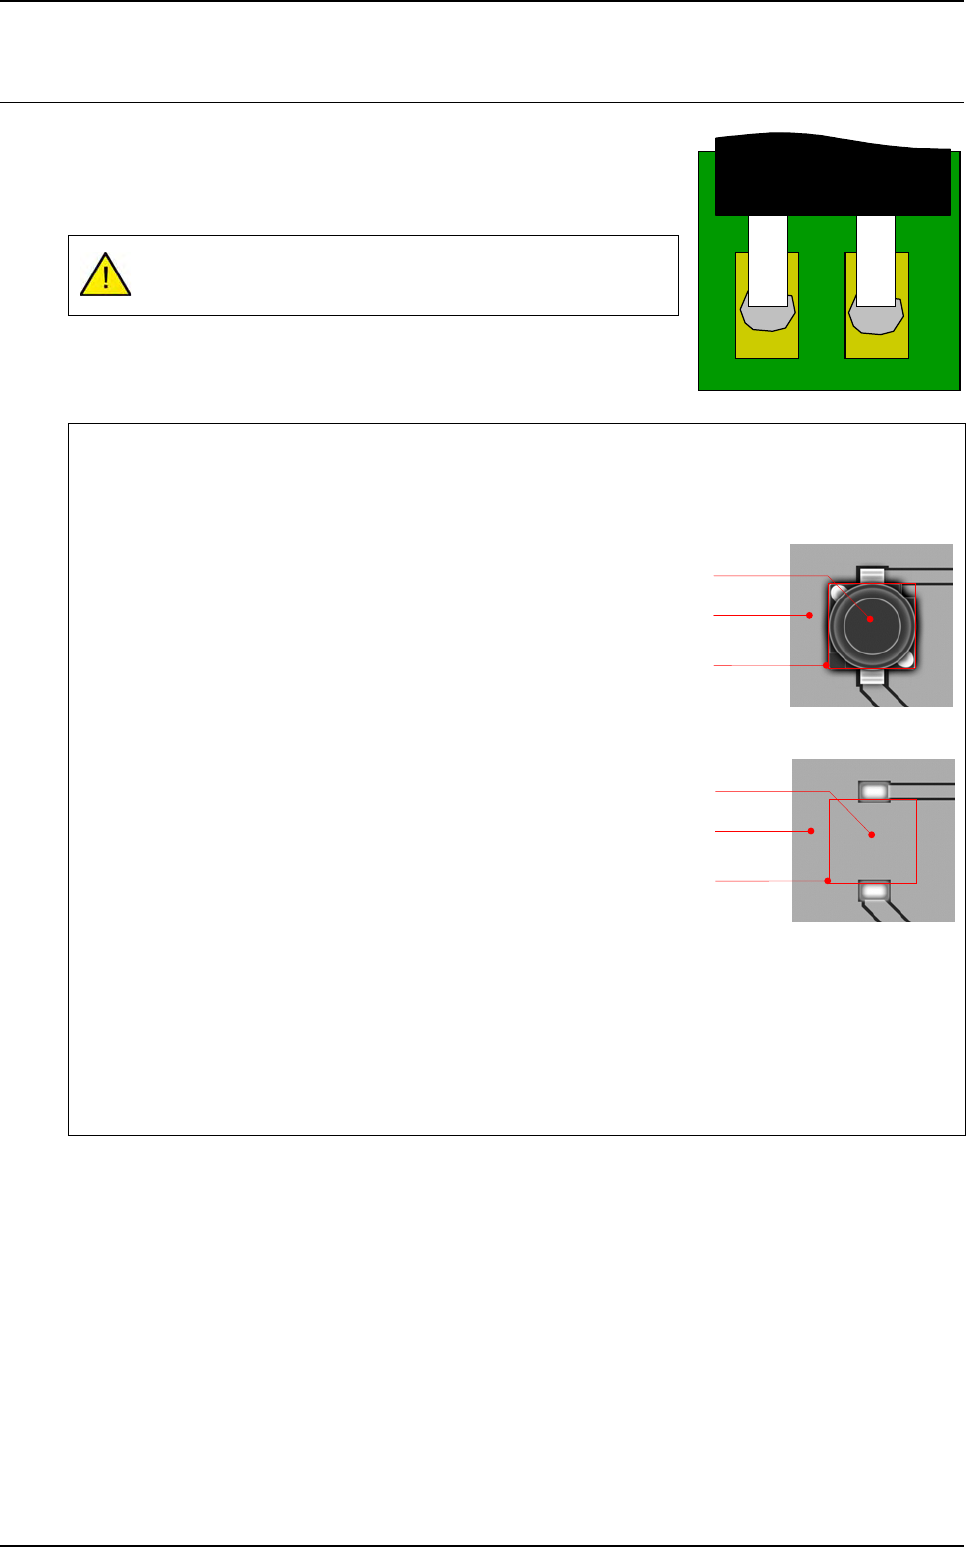
Application examples
To confirm the component presence, you can use the average of the histogram.
Present component
Average value of the histogram in gray levels: 20
Missing component
Average value of the histogram in gray levels: 200
Execution
When running an histogram outside of the picture the result will be not OK (= 0)
When running an histogram half on the picture and half outside the picture, the result is:
Cognex histogram: the value is calculated only on pixels which are on the picture.
ViTECHNOLOGY histogram: the value is calculated by considering the pixels outside the picture
to have a gray level at 0.
Component
Panel
Treatment
area
Missing
component
Panel
Treatment
area