VI User Manual.pdf - 第220页
Tools library 7 - 58 Vision 2007 4.10 User Manual Re v 01 7.9.4.3 3D analysis This algorithm ca n be used on a lot of case because it is very fle x ible. Principle This algorithm is an analysis on the 3 di- mensions of t…
Tools library
Vision 2007 4.10 User Manual Rev 01 7 - 57
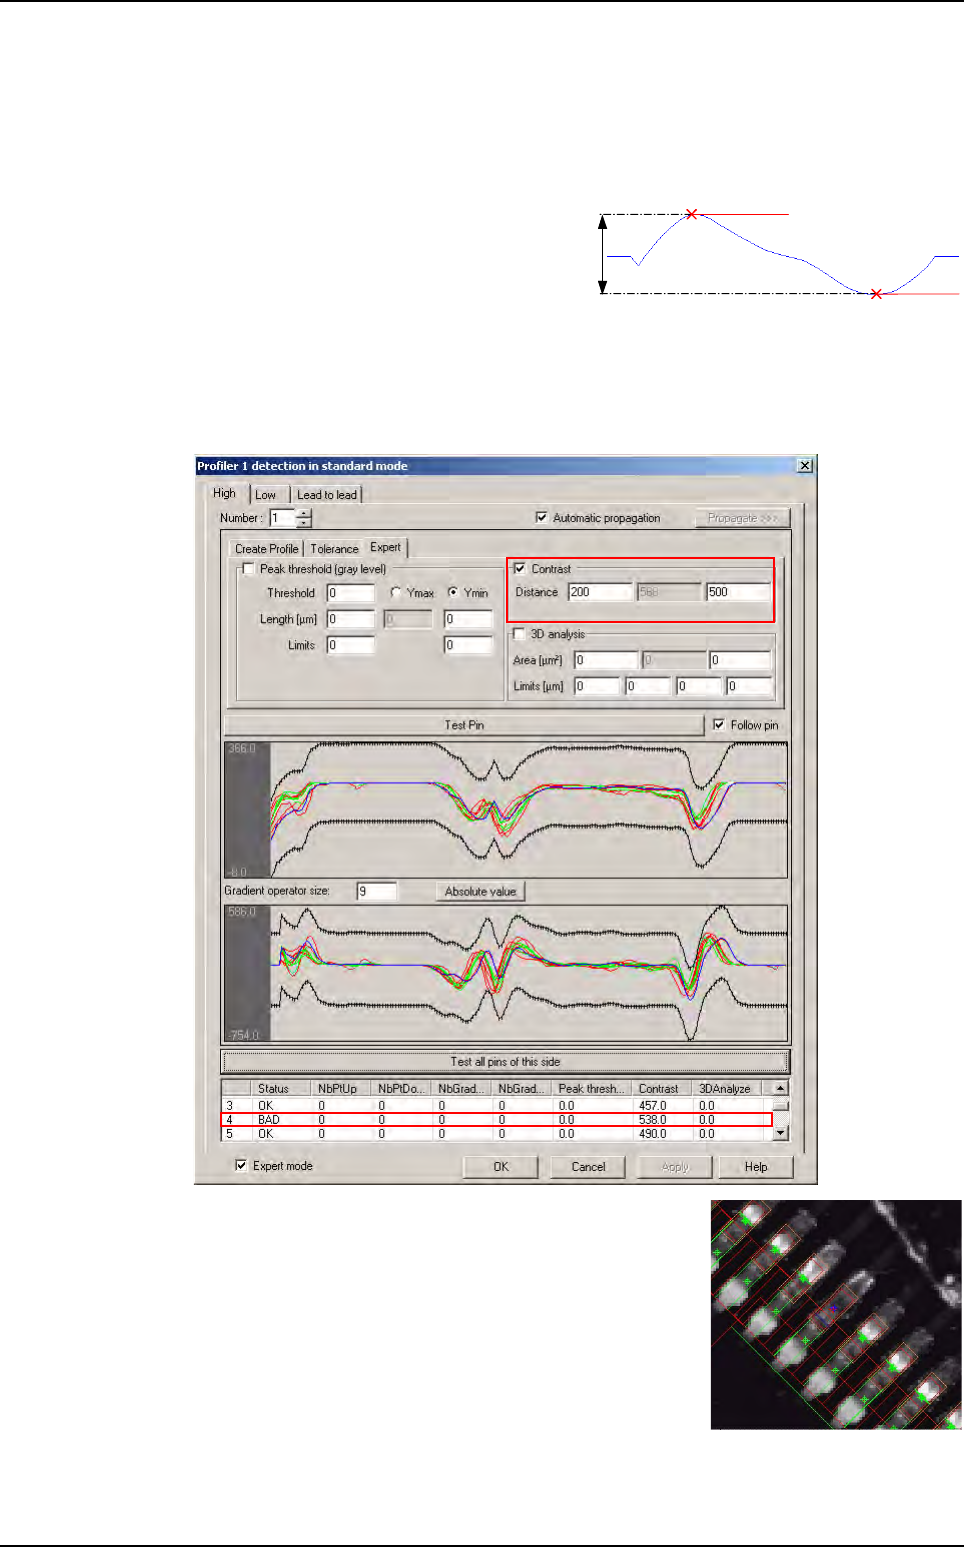
7.9.4.2 Contrast
This algorithm can be used when you have a difference of lead / joint contrast between
lifted and joined lead.
Principle
This algorithm measures the amplitude of
the gradient peak. This measure can corre-
spond, depending on the profile area posi-
tion, to the contrast of the outline.
Concrete case
Go in Expert tab.
In
Contrast
area enter the minimum and maximum value of distance (the acceptable limits).
For a lack of joint, result of contrast algorithm is bigger
compared with correct joint.
Max peak
Min peak
Max peak
Min peak
Profiler
™
in Custom
Tools library
7 - 58 Vision 2007 4.10 User Manual Rev 01
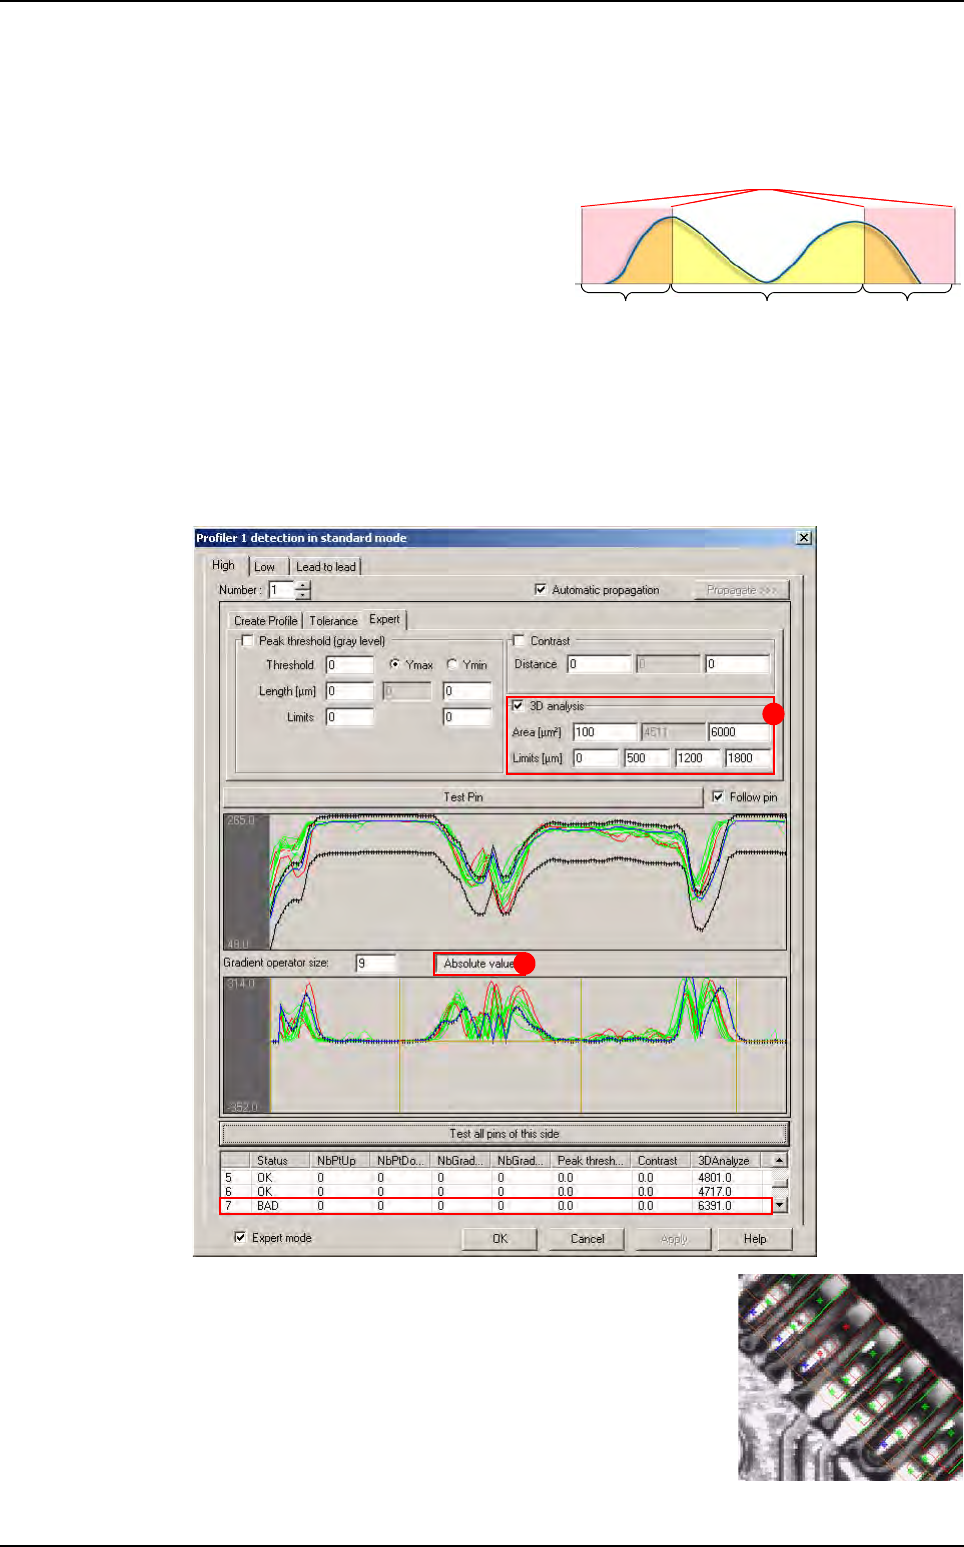
7.9.4.3 3D analysis
This algorithm can be used on a lot of case because it is very flexible.
Principle
This algorithm is an analysis on the 3 di-
mensions of the gradient (X, Y and gray
level). It measures the area under the ab-
solute value of the gradient. You can de-
fine 2 zones that will be ignored on the
calculation of the area.
Concrete case
Go in Expert tab.
In
3D analyze area (A), fill the Limits field to ignore a part of the gradient and define the
acceptable limits (
Area [µm²] field).
Press
Absolute value button (B) to see the absolute value of the gradient.
In this case, for a lifted lead, result of
3D Analysis algorithm
is bigger compared with a joined leads.
Considered areaIgnored area Ignored area
Limits
Mesured area
Considered areaIgnored area Ignored area
Limits
Mesured area
A
B
Profiler
™
in Custom
Tools library
Vision 2007 4.10 User Manual Rev 01 7 - 59
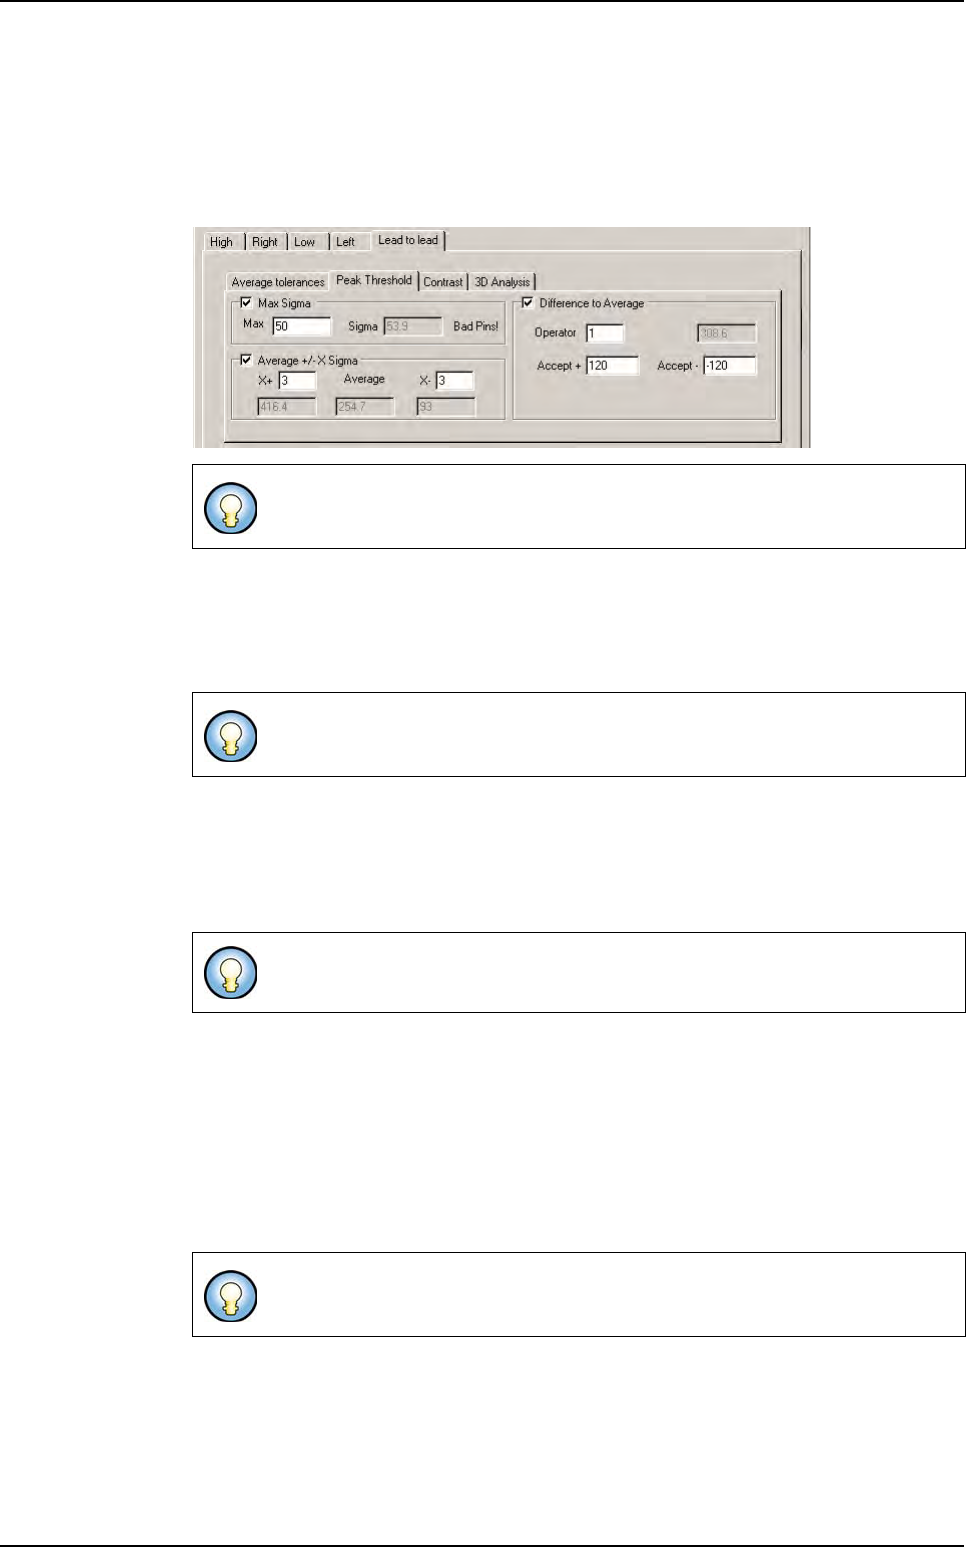
7.9.4.4 Lead to lead algorithm
Like for Lead to lead tolerance algorithm, Lead to lead algorithm is necessary to
adapt to the variation of the production.
The principle is to take all results of global algorithms and to make statistical calculation
with average and sigma. Results obtained in this way are adapted at each component.
Max sigma
This algorithm calculates the sigma of results coming from Global adjustment tool al-
gorithm. If sigma is too high, component contains lifted leads. You have to fix the maxi-
mum sigma you accept.
Average +/- X sigma
This algorithm verify that results are included between Average - X sigma and Average
+ X sigma
. All results that are outside these tolerances are considered as bad.
Fix X values.
Difference to Average +/- Sigma
This algorithm calculates each difference to the average.
Specify acceptable limits and operator:
Use
Operator 1 if defects are represented by high value (compared with the average).
Use
Operator -1
if defects are represented by small value (compared with the average).
Use Operator 0 if you do not know.
Only profiles and results validate as good by the Globat adjustment tool, are
pass to the
Lead to lead tool.
If the component has similar leads, sigma is small. If it contains different leads,
sigma is high. This algorithm allows to detect component with a lot of bad leads.
This algorithm allows to detect components with a small number of bad leads.
This algorithm allows to detect component with a small number of bad leads. It
is possible to use 1 or several
Lead to lead algorithm.
Profiler
™
in Custom