VI User Manual.pdf - 第320页
Optimization 12 - 2 Vi sion 2007 4.10 User Manual Rev 01 12.1.1 Optimized parameters 12.1.1.1 X/Y scale The X/Y Scale parameters enable adaptatio n of the X/Y scale ra tio of the trained model to the component’s real ima…
Optimization
Vision 2007 4.10 User Manual Rev 01 12 - 1
Chapter 12
Optimization
12.1 Auto Fine Tune (AFT)
The Auto Fine Tune (AFT) tool is a programming assistant using Vi-Pro and Histograms for models
in the library. It automatically optimizes the library to obtain:
Increased accuracy and repeatability:
• Vi-Pro uniform scale, X and Y scale optimization.
Fewer false faults:
• Vi-Pro score and contrast threshold.
• Histograms used in presence and polarity equations.
Shorter cycle time:
• Link permutation.
• Unused link deletion.
AFT enables transfer of a Vi-3K Series library to a Vi-5000 Series and vice versa. It also enables
execution of a .tst file in the process mode (debug) on an offline station.
To optimize a library with AFT you will need:
The library to be optimized.
A .tst file with the components to be optimized activated for testing.
Several full and empty panels.
Optimization
12 - 2 Vision 2007 4.10 User Manual Rev 01
12.1.1 Optimized parameters
12.1.1.1 X/Y scale
The X/Y Scale parameters enable adaptation of the X/Y scale ratio of the trained
model to the component’s real image. The optimization process automatically cal-
culates these parameters.
12.1.1.2 Vi-Pro uniform scale
The optimization process refines the uniform scale tolerances considering the new
X and Y scale parameters.
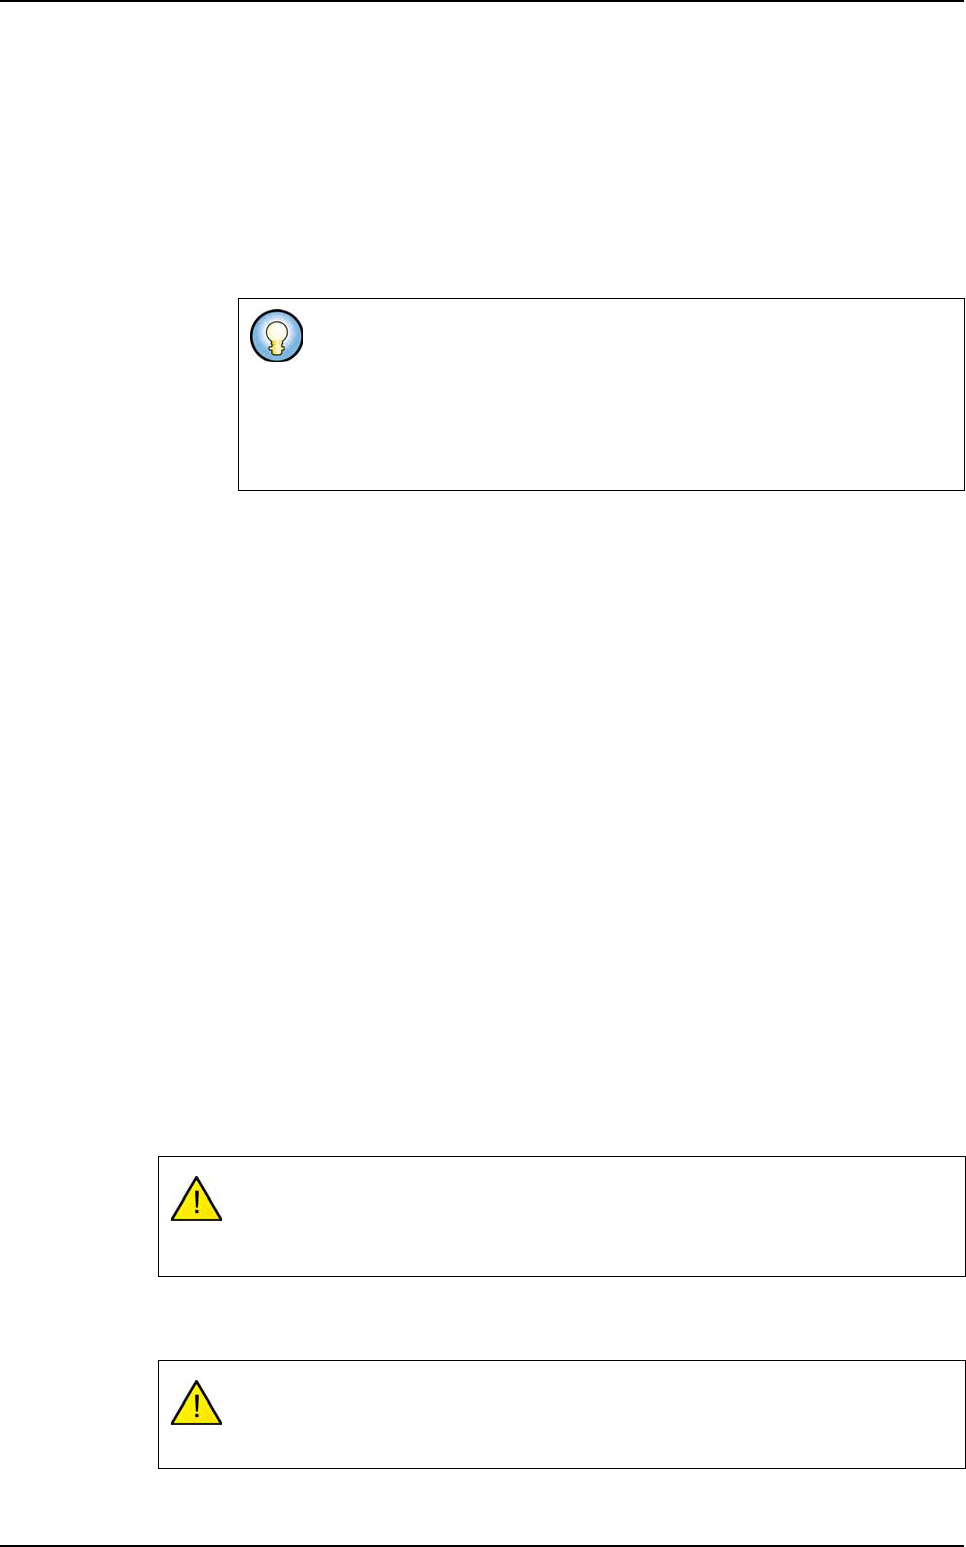
12.1.1.3 Score
The Score is the minimum limit
used by Vi-Pro to determine
whether an object found is a
valid instance of the trained
model. The optimization pro-
cess adjusts the score so that
no components are found vali-
dated on empty boards, and all
the components are found val-
idated on the full boards (if this
is possible).
12.1.1.4 Vi-Pro contrast threshold
The optimization process adapts the contrast threshold to minimize false faults on
full panels. The optimized contrast threshold is the minimum contrast Vi-Pro re-
turned for the model on full panels.
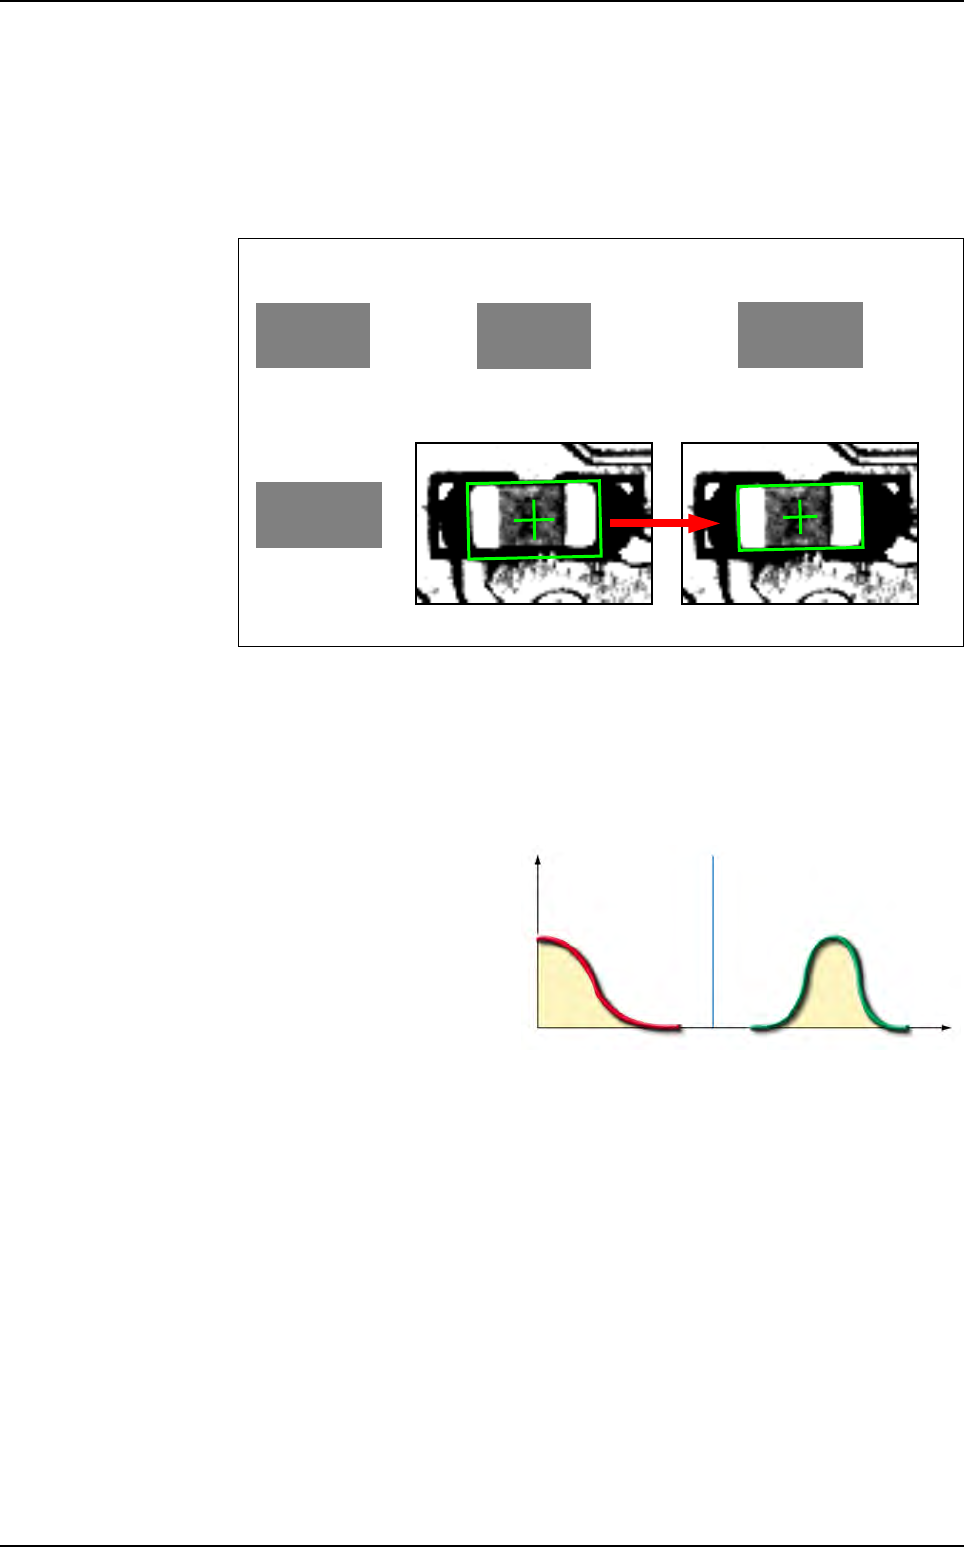
The X/Y Scale optimization has enlarged the trained model to best adapt it to the
real image.
Real image
Trained model
Best model
with respect
to the real image
Trained model
X Scale = 100%
Y Scale = 100%
Trained model
X Scale = 102%
Y Scale = 100%
Optimization X/Y Scale
Real image
Empty
board
results
Full
board
results
Score optimization (ideal case) (%)
0
F
r
e
q
u
e
n
c
y
(
%
)
Optimal score
(threshold
value)
Auto Fine Tune (AFT)
Optimization
Vision 2007 4.10 User Manual Rev 01 12 - 3
12.1.1.5 Histogram
The optimization process adjusts the upper and lower limits of the Histogram tools
used in presence and polarity equations to minimize false faults on full panels.
Detection logic
When you program a Histogram tool, you only have to choose the scoring parame-
ter and the upper and lower limits. But the Histogram tool will, however, affect the
model in a different way depending on the model's equation.
Positive logic optimization
The optimized upper and lower limits are the maximum and the minimum values of
the selected Histogram parameter returned on full panels.
Negative logic optimization
The optimization process gathers the returned values of the selected Histogram pa-
rameter on full panels. If the average value is greater than 128 then the optimized
lower limit is 0 and the upper limit is the minimum returned value. If the average val-
ue is less than 128 then the optimized lower limit is the maximum returned value
and the upper limit is 255.
12.1.1.6 Links optimization
The optimization process arranges the different links for each Jedec to minimize the
execution time. It sorts the links according to their occurrence frequency. The most
used link becomes the root and the least used becomes the last one.
12.1.2 AFT recording and optimization wizard
Open a .tst file and check that it is attached to the library to be optimized (The components
to be optimized should be activated for the test).
Click on the Test file configuration icon in the tool bar of the .tst file. The Test file config-
uration window appears. Choose the AFT tab and select the AFT safety directory.
A wizard will guide you through the steps of the optimization process.With the .tst file window
active, select the Wizard option from the AFT menu. The AFT Wizard will be opened.
If a model's polarity equation is R2, the Histogram programmed in window 2 should
return OK if the component's polarity is right.
This means the Histogram is programmed with a positive logic.
If this model's polarity equation is NOT R2, the Histogram should return FALSE if
the component's polarity is right. In this case, the Histogram is programmed with a
negative logic.
Check that the directory selected has sufficient space available to store the AFT
files.
These files often take up more than 30 Mb for each board saved.
Before you start an optimization process, make a copy of the library you wish to op-
timize (the optimized library will automatically overwrite the library to be optimized
at the end of the process).
Auto Fine Tune (AFT)