VI User Manual.pdf - 第322页
Optimization 12 - 4 Vi sion 2007 4.10 User Manual Rev 01 12.1.2.1 Selection You can choose to record panels and opti- mize the libra ry on these records (defa ult), to record panels only, or to optimize the libr ary on e…
Optimization
Vision 2007 4.10 User Manual Rev 01 12 - 3
12.1.1.5 Histogram
The optimization process adjusts the upper and lower limits of the Histogram tools
used in presence and polarity equations to minimize false faults on full panels.
Detection logic
When you program a Histogram tool, you only have to choose the scoring parame-
ter and the upper and lower limits. But the Histogram tool will, however, affect the
model in a different way depending on the model's equation.
Positive logic optimization
The optimized upper and lower limits are the maximum and the minimum values of
the selected Histogram parameter returned on full panels.
Negative logic optimization
The optimization process gathers the returned values of the selected Histogram pa-
rameter on full panels. If the average value is greater than 128 then the optimized
lower limit is 0 and the upper limit is the minimum returned value. If the average val-
ue is less than 128 then the optimized lower limit is the maximum returned value
and the upper limit is 255.
12.1.1.6 Links optimization
The optimization process arranges the different links for each Jedec to minimize the
execution time. It sorts the links according to their occurrence frequency. The most
used link becomes the root and the least used becomes the last one.
12.1.2 AFT recording and optimization wizard
Open a .tst file and check that it is attached to the library to be optimized (The components
to be optimized should be activated for the test).
Click on the Test file configuration icon in the tool bar of the .tst file. The Test file config-
uration window appears. Choose the AFT tab and select the AFT safety directory.
A wizard will guide you through the steps of the optimization process.With the .tst file window
active, select the Wizard option from the AFT menu. The AFT Wizard will be opened.
If a model's polarity equation is R2, the Histogram programmed in window 2 should
return OK if the component's polarity is right.
This means the Histogram is programmed with a positive logic.
If this model's polarity equation is NOT R2, the Histogram should return FALSE if
the component's polarity is right. In this case, the Histogram is programmed with a
negative logic.
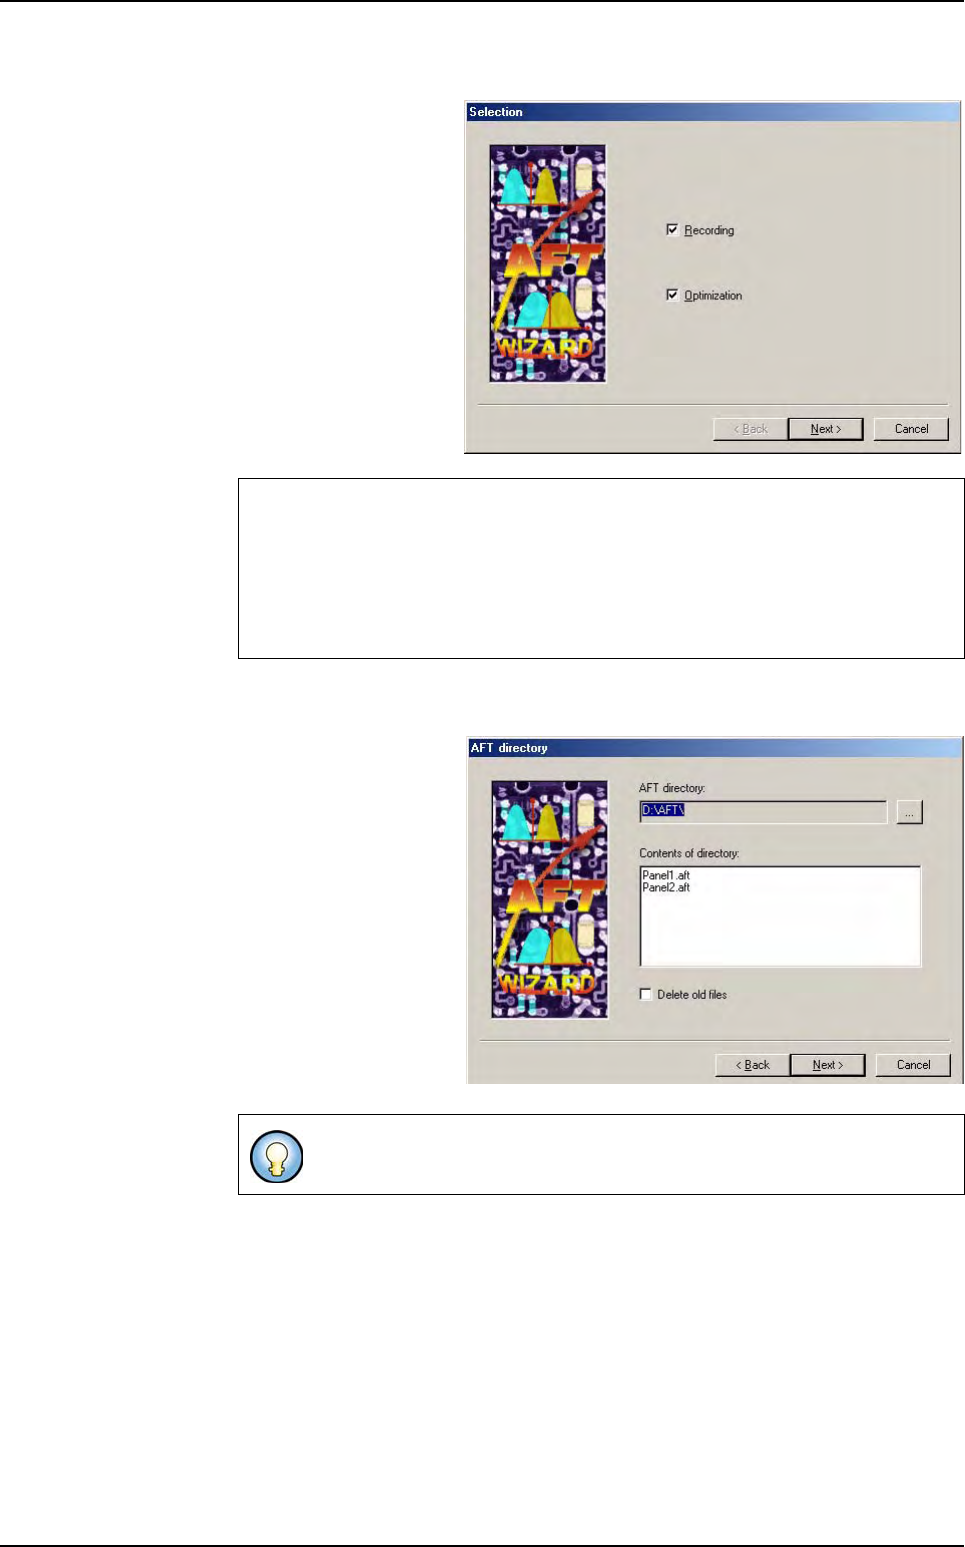
Check that the directory selected has sufficient space available to store the AFT
files.
These files often take up more than 30 Mb for each board saved.
Before you start an optimization process, make a copy of the library you wish to op-
timize (the optimized library will automatically overwrite the library to be optimized
at the end of the process).
Auto Fine Tune (AFT)
Optimization
12 - 4 Vision 2007 4.10 User Manual Rev 01
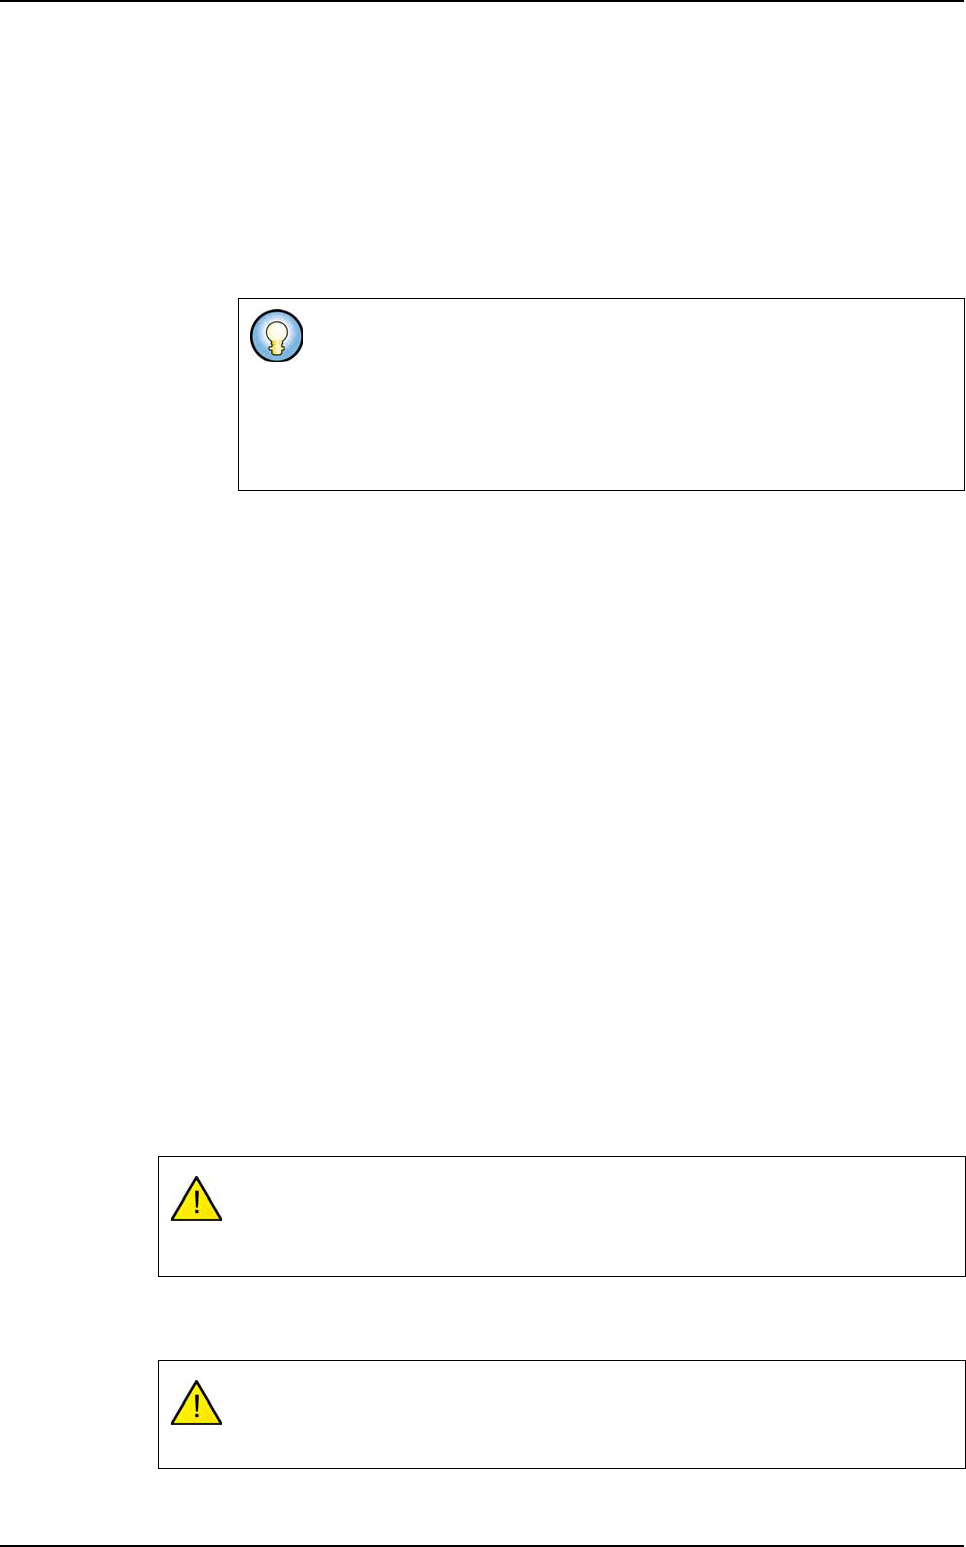
12.1.2.1 Selection
You can choose to
record panels and opti-
mize the library on these
records (default), to
record panels only, or to
optimize the library on
existing records.
Click Next to go to the
next step.
12.1.2.2 AFT directory
Select the AFT safety di-
rectory if required.
This window lists the
previous AFT files found
in the selected directory.
If you wish to overwrite
the previous records,
tick Delete old files.
Otherwise, the new
records will be added to
the previous ones.
Click Next to go to the
next step.
We will describe the whole process (recording and optimization) here.
If you select only recording or only optimization, the wizard steps will appear in a
different order.
If you already have AFT records, you can run the AFT Wizard with only Optimi-
zation selected on an offline station.
The optimization steps will use all the AFT files in the selected directory.
Auto Fine Tune (AFT)
Optimization
Vision 2007 4.10 User Manual Rev 01 12 - 5
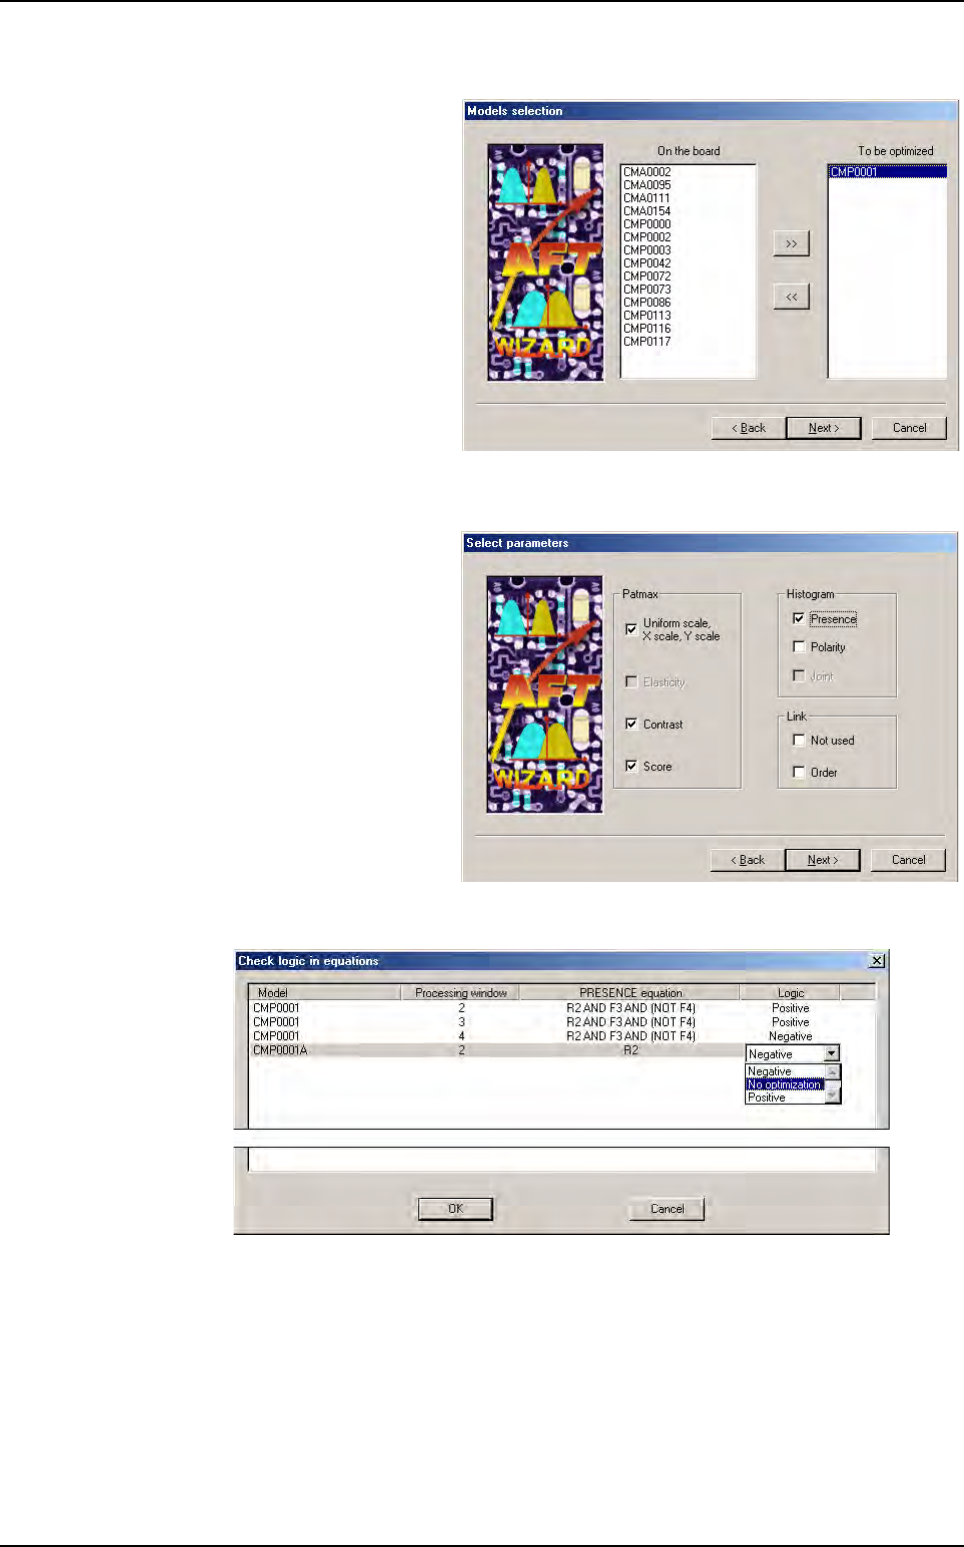
12.1.2.3 Models selection
A list of the models
available in the library
appears.
Select the models you
wish to optimize using
>> and << and click
Next.
12.1.2.4 Select parameters
Select the parameters
you wish to optimize.
If you tick
Presence
or
Polarity
optimization in
the
Histogram
section,
the system will analyze
the model equations to
look for Histogram tools.
A window will appear and list the Histogram tools found.
You have to confirm the detection logic used in the equation for each model (in most
cases, the equations are quite simple, and the logic proposed is OK).
If you need to modify the logic proposed for a model, right-click on the field, and a list
box will appear. Once each detection logic is correct, press
OK
to validate the data and
return to the AFT Wizard.
Click
Next
to go to the next step.
Auto Fine Tune (AFT)