VI User Manual.pdf - 第315页
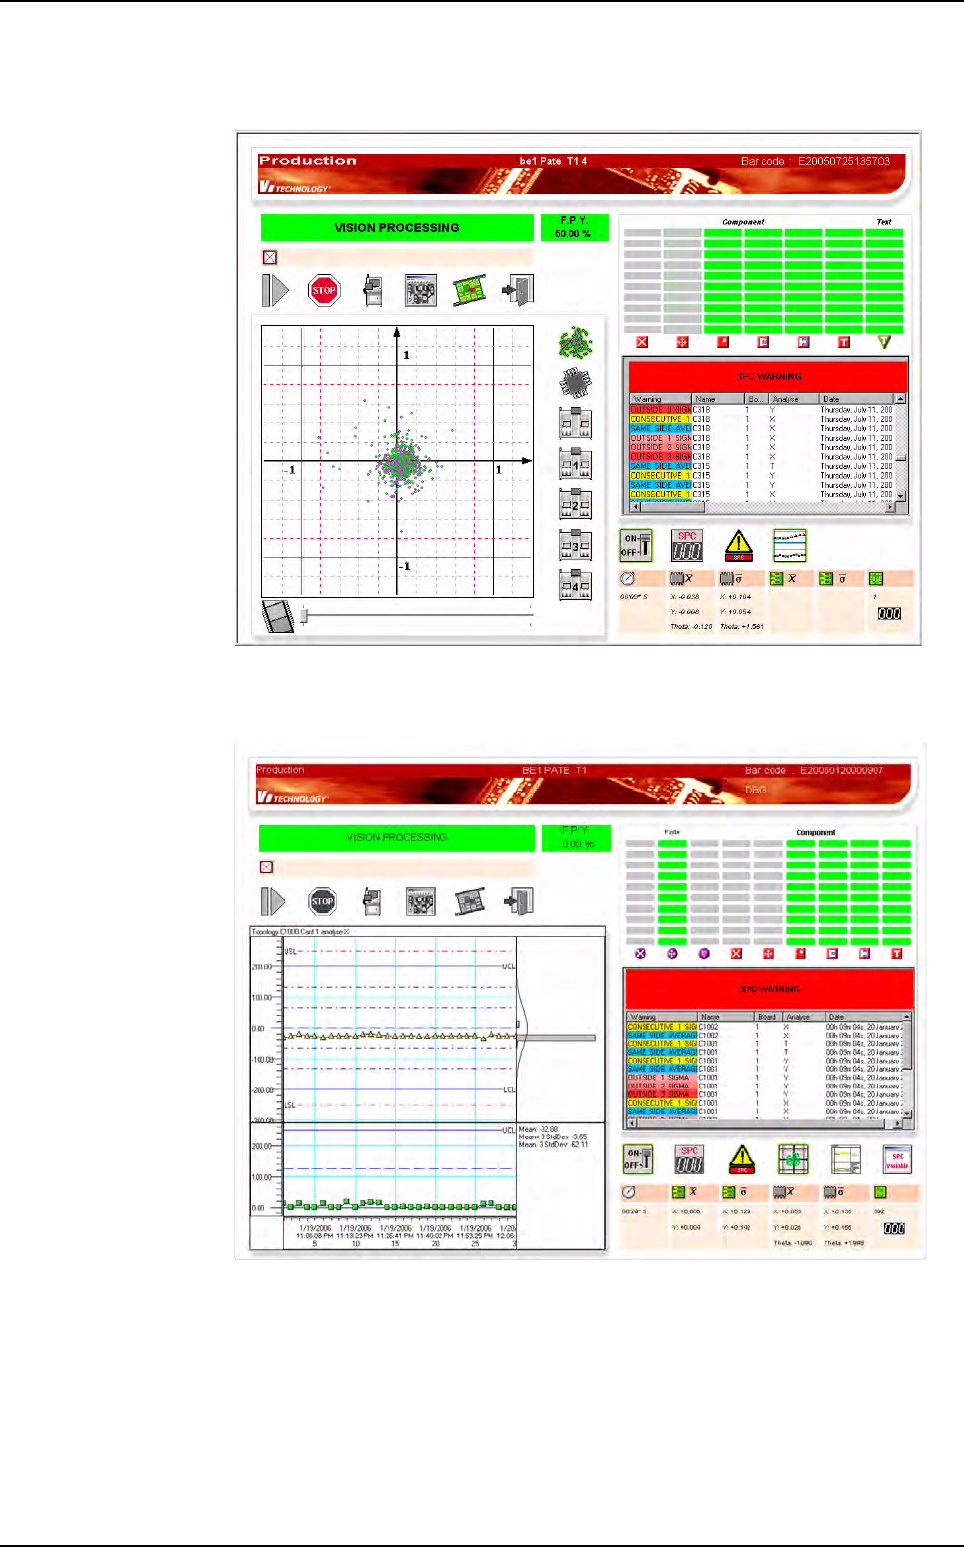
Production Vision 2007 4.10 User Manua l Rev 01 11 - 15 When the SPC engine co mpute 1 SPC W ARNING , the warnin g dialog bo x is auto- matically displayed. When you click on a SPC WARNING , it display the corresponding …
Production
11 - 14 Vision 2007 4.10 User Manual Rev 01
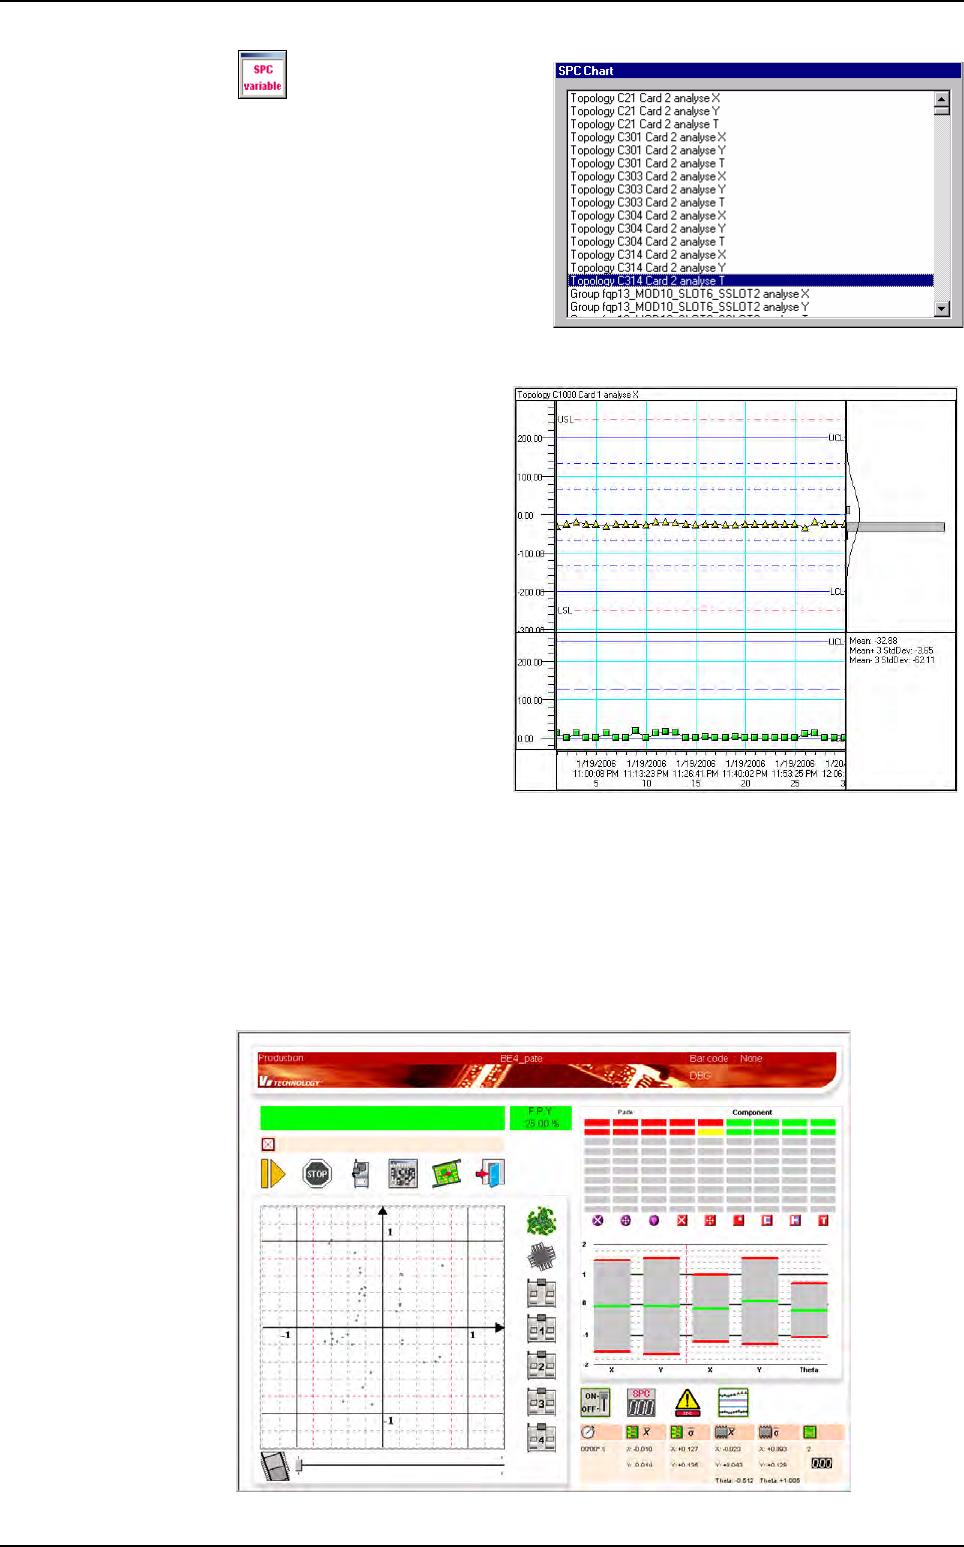
Display the list of the ana-
lyzed variables. The charts cor-
respond to the selected variable.
11.3.2.2 SPC charts display area
4 charts which shows the
SPC values (and warnings):
Chart X: SPC variable values
(and warnings).
Chart S: sigma values of the
data which compose each
SPC point.
Chart H: histogram which
presents the distribution of the
SPC values.
Chart T: different statistical
values concerning the select-
ed point.
LSL and USL: Lower and Up-
per Specification Limits corre-
spond to the classical tolerances. When a measured value is outside these values,
it is considered as a defect.
LCL and UCL: Lower and Upper Control Limits correspond to 80% of LSL and USL.
SPC charts display area
11.3.2.3 SPC running in production mode
When the production mode is launched, the screen below is displayed, with the
SPC button visible.
Embedded SPC
Production
Vision 2007 4.10 User Manual Rev 01 11 - 15
When the SPC engine compute 1 SPC WARNING, the warning dialog box is auto-
matically displayed.
When you click on a
SPC WARNING
, it display the corresponding chart:
Embedded SPC
Production
11 - 16 Vision 2007 4.10 User Manual Rev 01
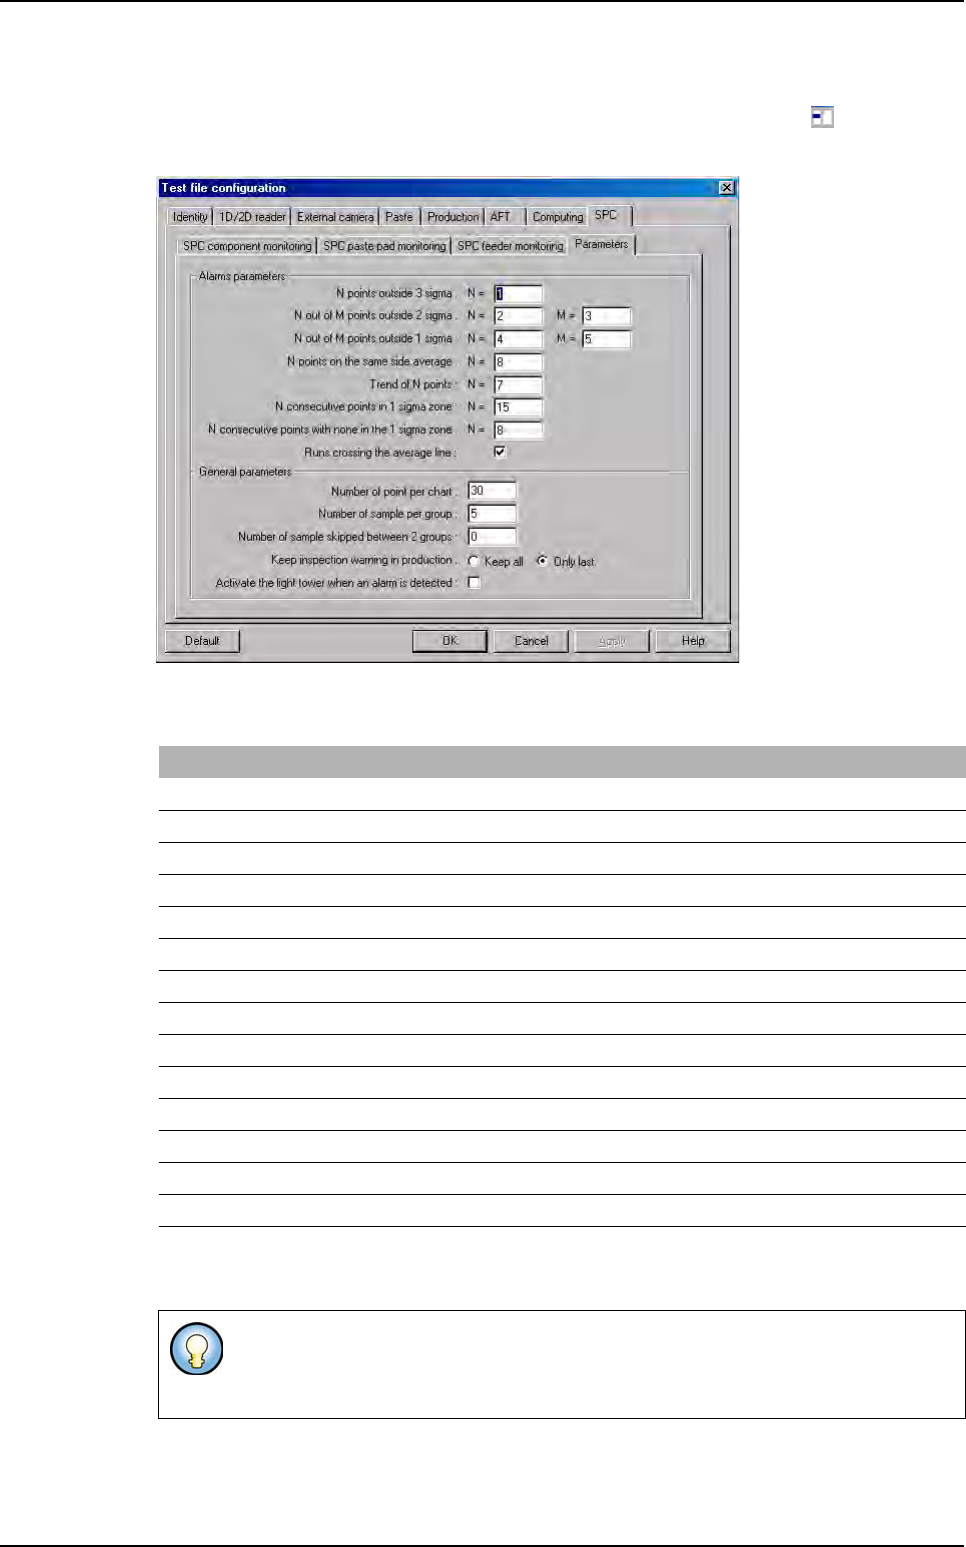
11.3.3 SPC default values
In order to edit the SPC engine parameters for one .tst file defined, click on icon in the tool
bar. In the Test file configuration window select SPC tab and Parameters sub tab.
The SPC engine parameters are in the DefaultValue.ini file under the key [SPC].
You can choose to use the light tower to alert when an SPC warning is detected. It will use
the orange light. The light tower lit off when warnings are removed.
[SPC] SPC functions parameters
N_OUTSIDE_3_SIGMA = 1
N_OUTSIDE_2_SIGMA = 2
M_OUTSIDE_2_SIGMA = 3
N_OUTSIDE_1_SIGMA = 4
M_OUTSIDE_1_SIGMA = 5
N_SAME_SIDE_AVERAGE = 8
N_TREND = 7
N_CONSECUTIVE_1_SIGMA = 15
N_CONSECUTIVE_OUT_SIGMA = 8
Number of point per chart = 30
Number of sample per group = 5
Number of sample skipped between 2 groups = 0
Show only last inspection warning = 1
Warning of runs crossing the average line used = 1
The SPC engine parameters modification for one .tst defined in the Test file config-
uration window, will not modify the SPC default values recorded in the DefaultVal-
ue.ini file.
Embedded SPC