VI User Manual.pdf - 第313页
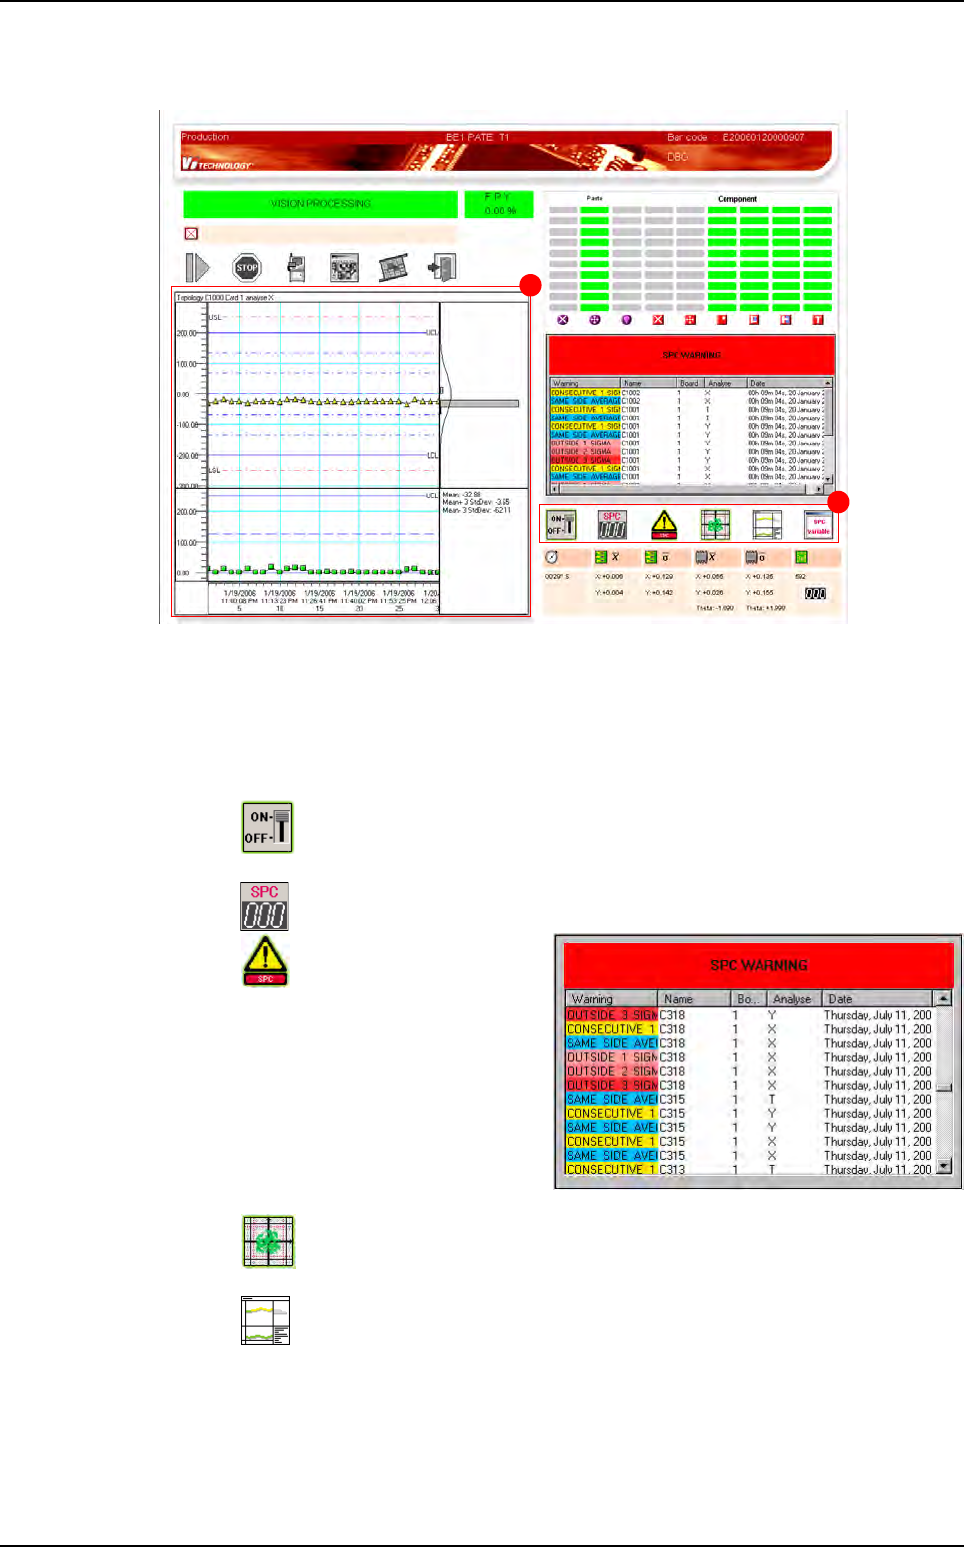
Production Vision 2007 4.10 User Manua l Rev 01 11 - 13 1 1.3.2 SPC option in production screen A SPC toobar. B SPC charts display area. 11.3.2.1 SPC toolbar Function of each button: Activate/deactivate the analysis. The…
Production
11 - 12 Vision 2007 4.10 User Manual Rev 01
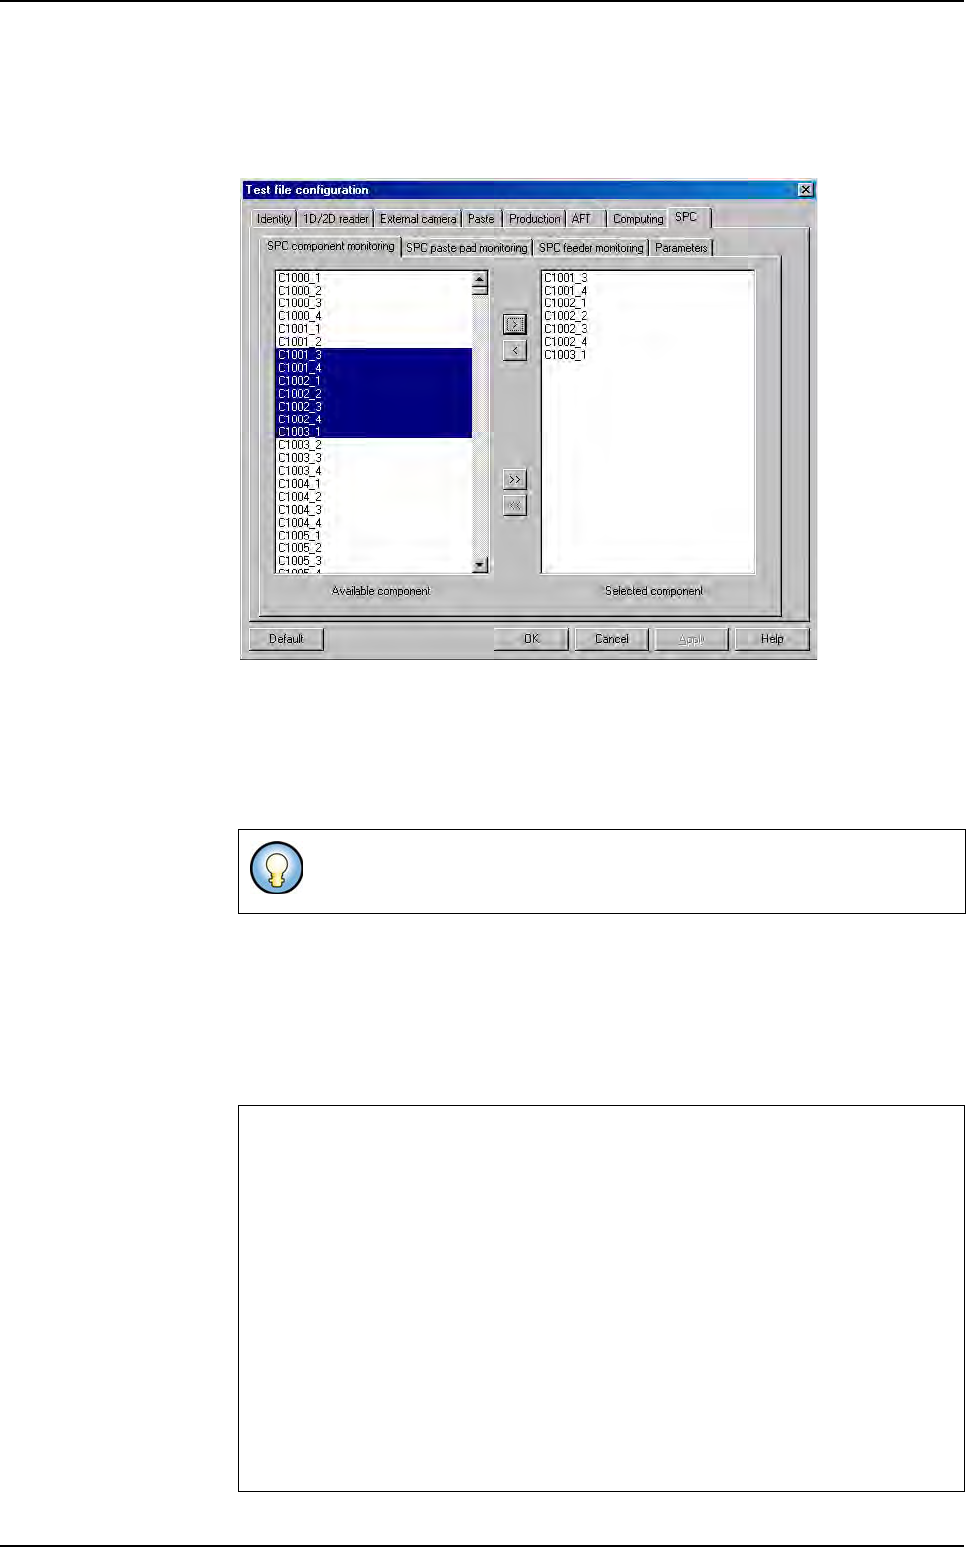
11.3.1.3 Variable selection to analyze with the SPC engine
Editing the .tst file, the users can specify which component, paste or feeder they
want to study.
Selection of the components to analyze with the SPC engine.
If the user chooses a component, the SPC engine will study the evolution of its
position deviation (3 variables: X, Y, Theta).
If the user chooses a paste pad, the SPC engine will study the evolution of its
surface.
You can study the serigraphic mask evolution by selecting the X, Y and/or theta
evolution (screenshot TSTeditPaste.bmp). It calculate the general deviation off
all past pad.
If the user chooses a feeder, the SPC engine will study the evolution of the posi-
tion deviation for all the components associated to this feeder (3 variables: aver-
age X, Y, Theta of the corresponding components).
Components and paste pads are identified by their topology followed by
their board number.
The SPC engine studies each variable with the following tests (also called SPC functions).
Each of them can generate a warning.
1 point outside 3 sigma
2 out of 3 points outside 2 sigma
4 out of 5 points outside 1 sigma
8 points on the same side of the average
Trend of 7 points
15 consecutive points in the 1 sigma zone
Too few or too many runs
8 consecutive points with none in the 1 sigma zone – either side
Runs crossing the average line.
Embedded SPC
Production
Vision 2007 4.10 User Manual Rev 01 11 - 13
11.3.2 SPC option in production screen
A SPC toobar.
B SPC charts display area.
11.3.2.1 SPC toolbar
Function of each button:
Activate/deactivate the analysis. The user can come back to the classical
Production screen.
Reset the analysis.
Display the list of the warn-
ings found. The red button
SPC WARNING allows to clear it.
The charts correspond to the se-
lected warning.
Display the curves or the group of dots.
Select the graphs type to display.
B
A
Embedded SPC
Production
11 - 14 Vision 2007 4.10 User Manual Rev 01
Display the list of the ana-
lyzed variables. The charts cor-
respond to the selected variable.
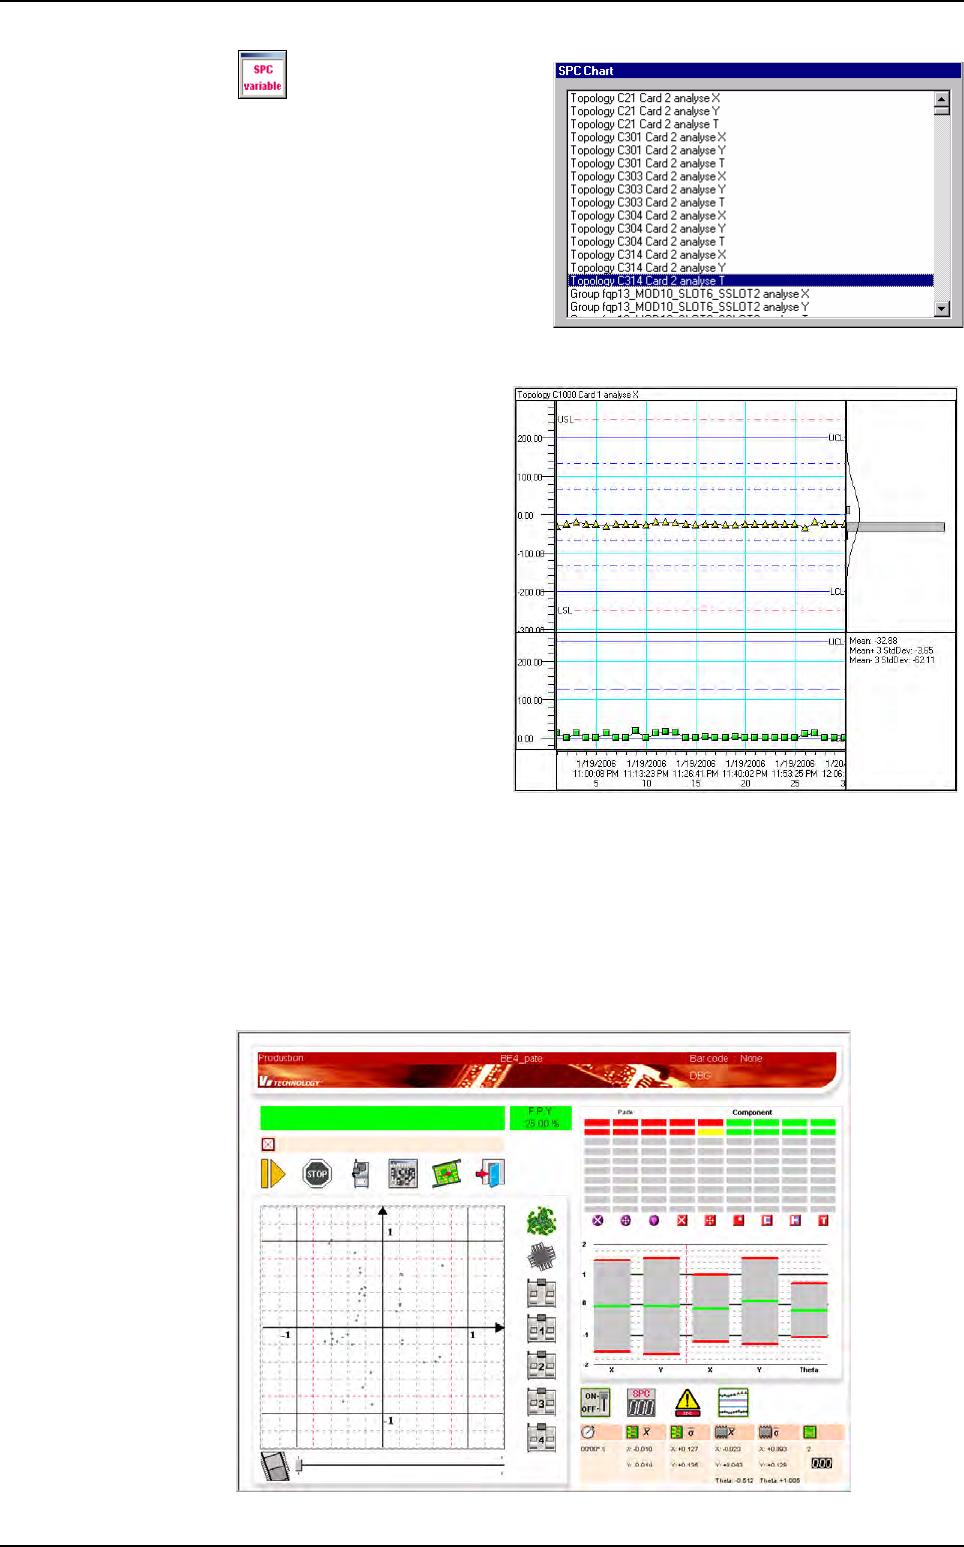
11.3.2.2 SPC charts display area
4 charts which shows the
SPC values (and warnings):
Chart X: SPC variable values
(and warnings).
Chart S: sigma values of the
data which compose each
SPC point.
Chart H: histogram which
presents the distribution of the
SPC values.
Chart T: different statistical
values concerning the select-
ed point.
LSL and USL: Lower and Up-
per Specification Limits corre-
spond to the classical tolerances. When a measured value is outside these values,
it is considered as a defect.
LCL and UCL: Lower and Upper Control Limits correspond to 80% of LSL and USL.
SPC charts display area
11.3.2.3 SPC running in production mode
When the production mode is launched, the screen below is displayed, with the
SPC button visible.
Embedded SPC