VI User Manual.pdf - 第185页
Tools library Vision 2007 4.10 User Manua l Rev 01 7 - 23 7.5 Histogram The Histogram too l enables measureme nt of the brightness in a pr e- defined window (avera ge gray level of the pixe l population). It is mainly us…
Tools library
7 - 22 Vision 2007 4.10 User Manual Rev 01
7.4.2.2 Edge test
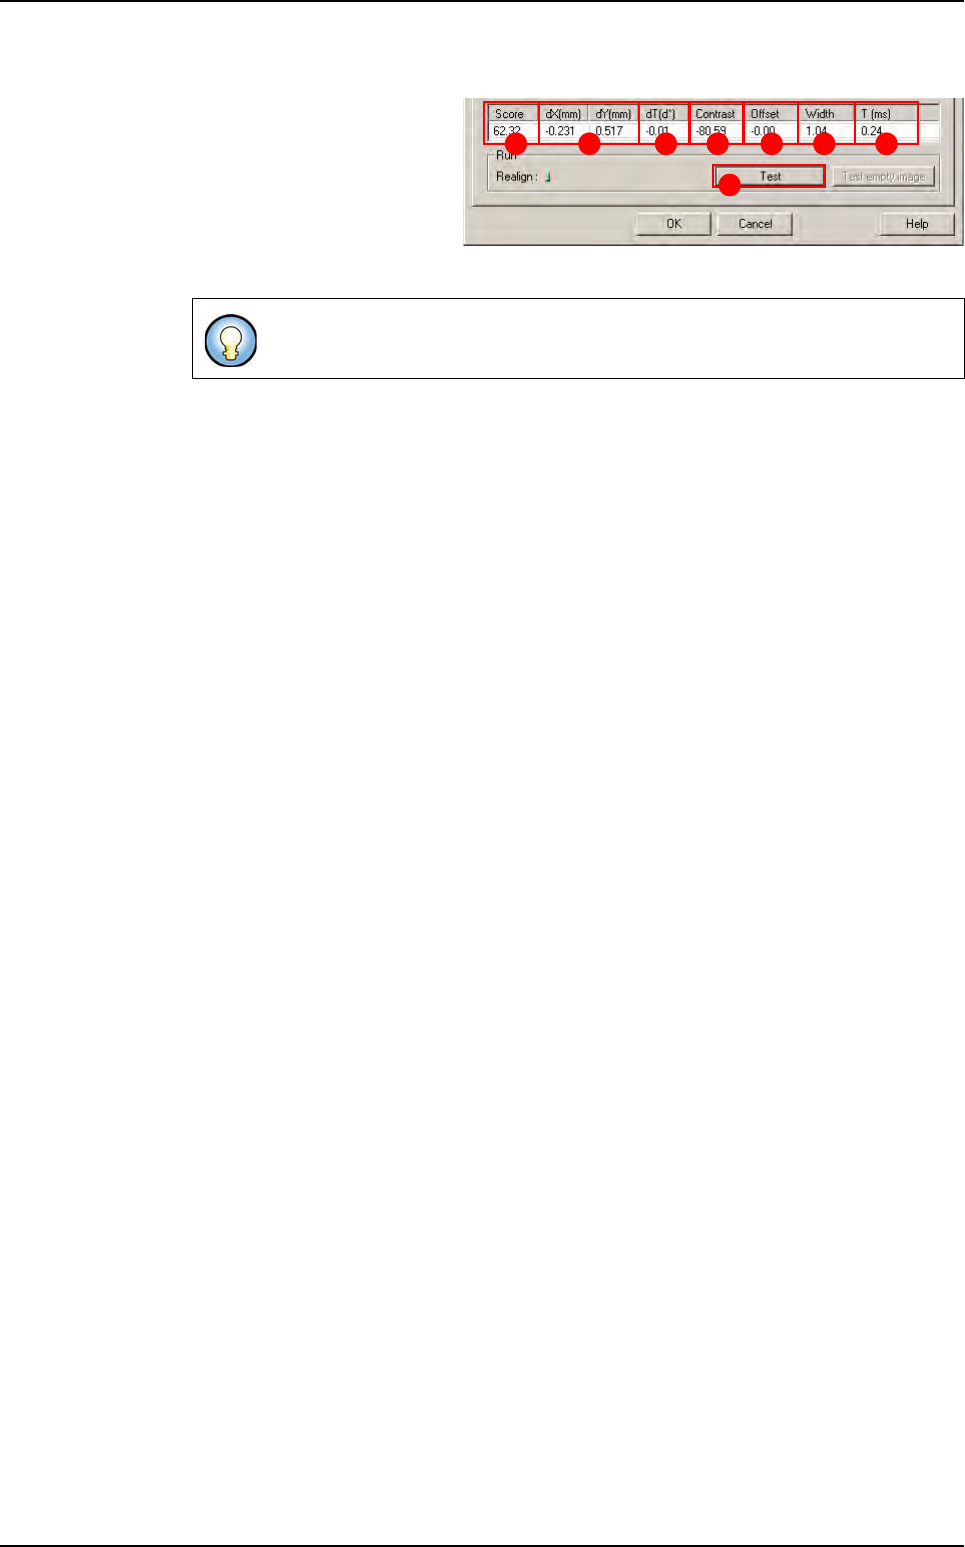
Click on Test (A) button to
apply all the inspection pa-
rameters to the model.
Score (B): score of the test-
ed tool (rate of detection suc-
cess).
dXY(mm)
(
C
): position in X and Y between the transitions (center between the 2 transitions).
dT(d°) (D): position result in theta of the tested model.
Contrast (E): difference of a transition, in gray level values between background bright-
ness and component brightness. This value is the average of the transition contrast
found during the test.
Offset (F):
Width (G): width between the transitions found.
T (ms) (H): inspection time.
If only one transition is looked for, this is the position of the transition found.
A
B C D E F G H
Edge
Tools library
Vision 2007 4.10 User Manual Rev 01 7 - 23
7.5 Histogram
The Histogram tool enables measurement of the brightness in a pre-
defined window (average gray level of the pixel population). It is mainly
used for the presence / absence of the component body, the weld
seam and for component polarity.
7.5.1 Model description tab
1. On the Model description tab, in the Edit a model window, choose the treatment operation:
a new Histogram tab appears behind the Model description tab.
2. Click on Edit area button to place the model encompassing area exactly on the image.
This histogram sends back no position values in X, Y or angle.
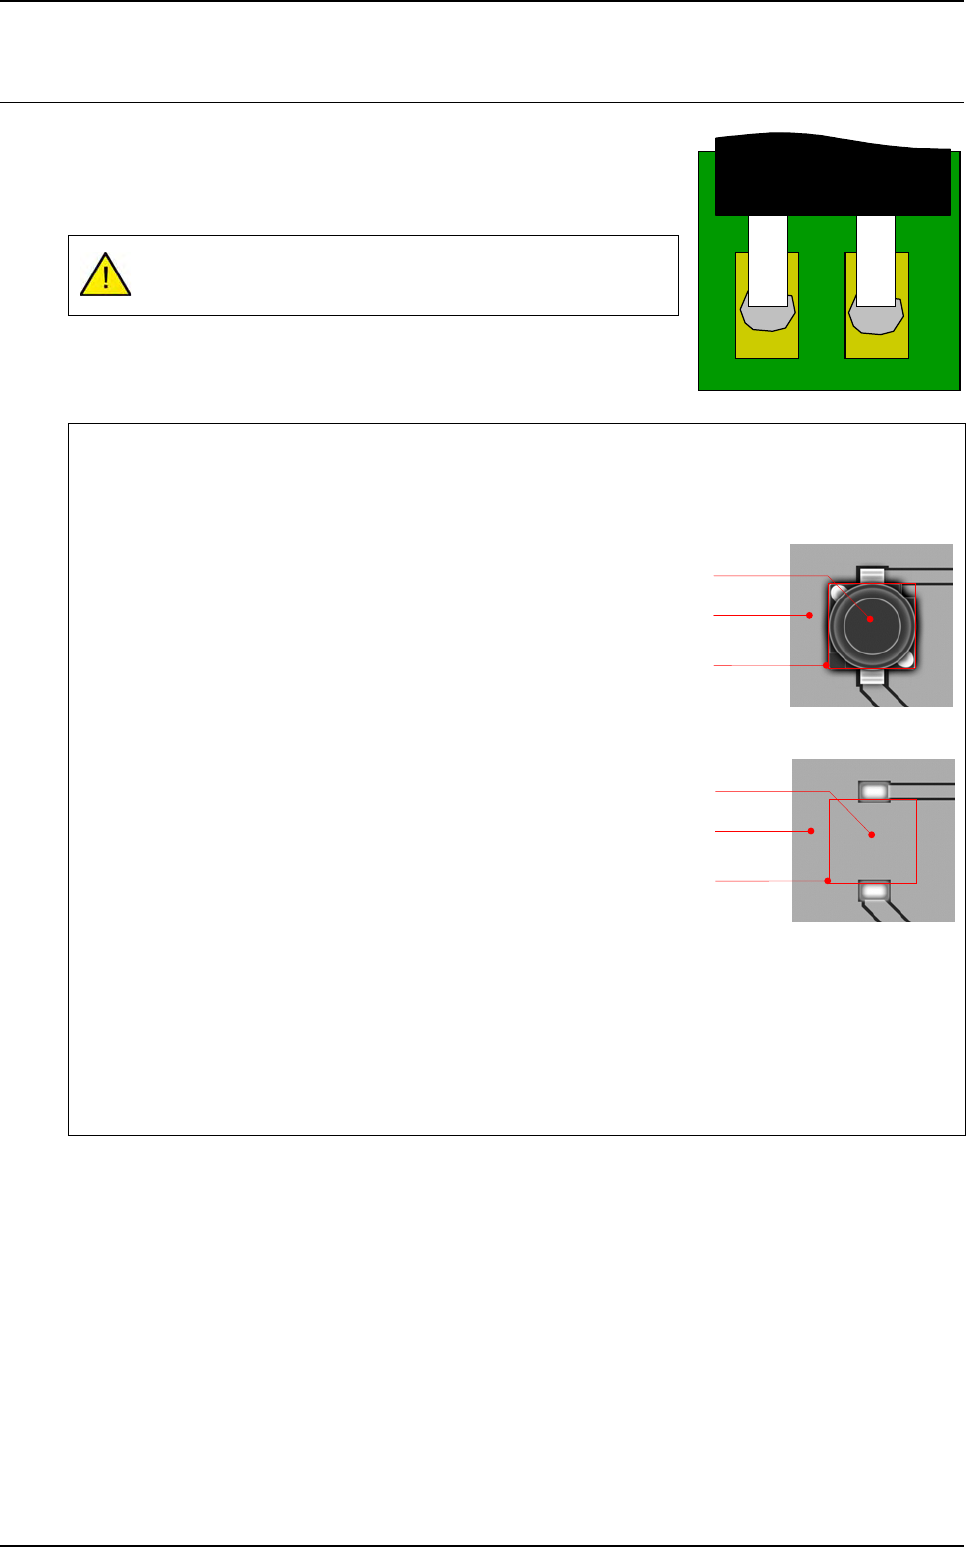
Application examples
To confirm the component presence, you can use the average of the histogram.
Present component
Average value of the histogram in gray levels: 20
Missing component
Average value of the histogram in gray levels: 200
Execution
When running an histogram outside of the picture the result will be not OK (= 0)
When running an histogram half on the picture and half outside the picture, the result is:
Cognex histogram: the value is calculated only on pixels which are on the picture.
ViTECHNOLOGY histogram: the value is calculated by considering the pixels outside the picture
to have a gray level at 0.
Component
Panel
Treatment
area
Missing
component
Panel
Treatment
area
Tools library
7 - 24 Vision 2007 4.10 User Manual Rev 01
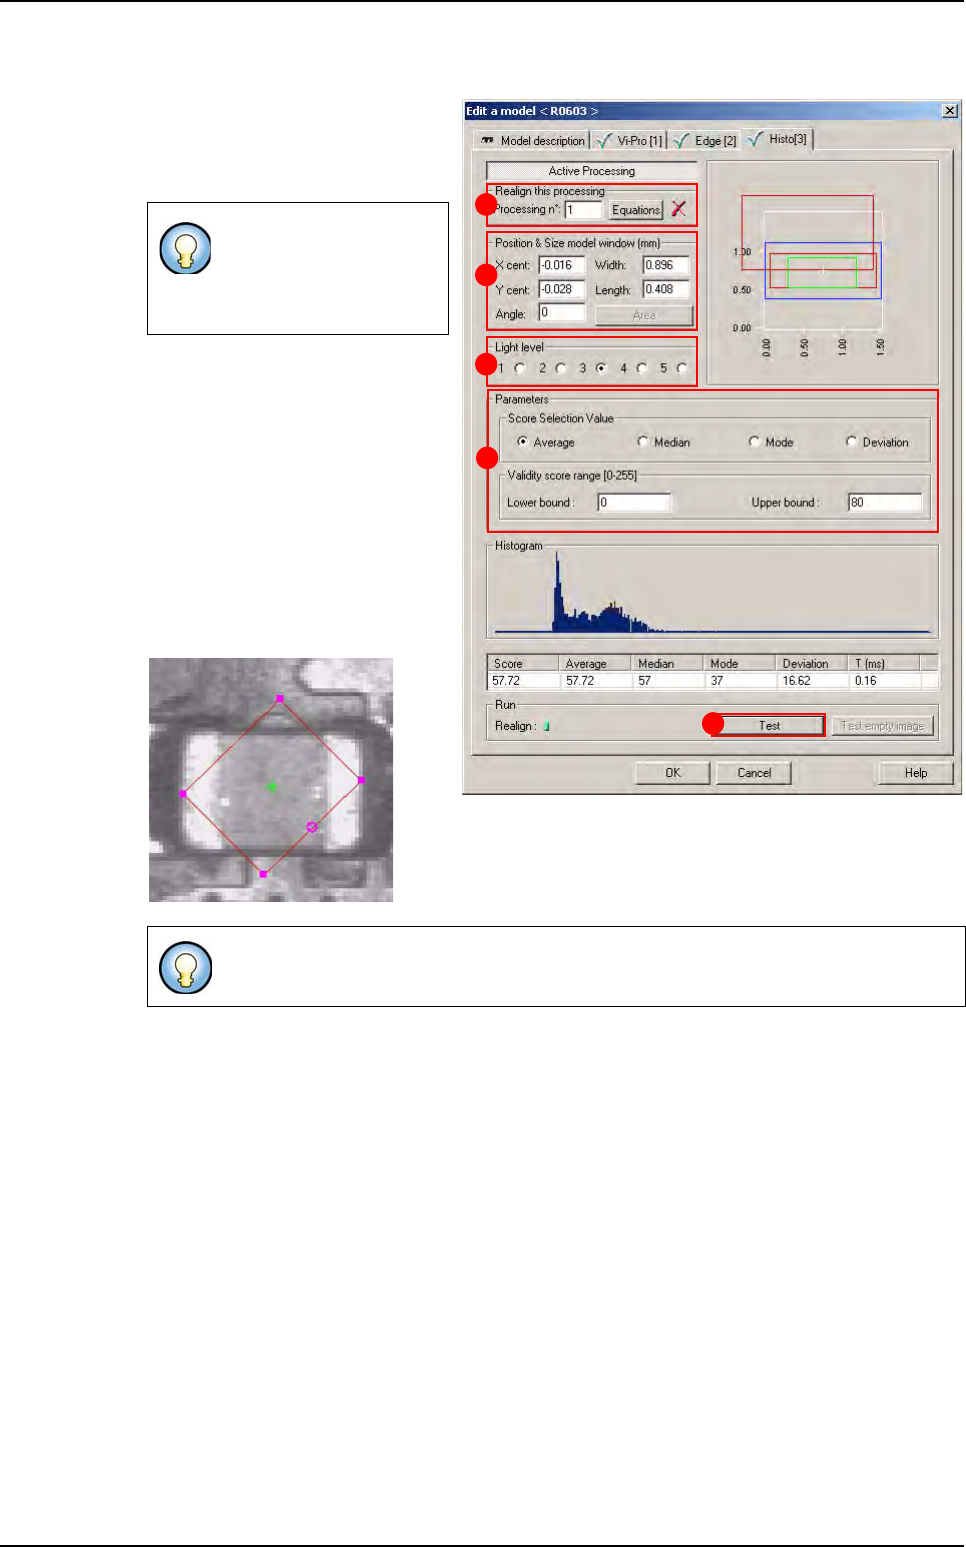
7.5.2 Histogram tab
1.
Use
Realign this processing
(
A
)
section if you want to realign the po-
sition of the tool with another one
(not available for window 1).
2. In Position & Size model window
(mm) (B) section, enter the size
and the position of the histogram
area. Histograms areas can be
defined at any time.
Press Area button and use the
mouse to rotate the area directly
on the picture in the camera
window, using the magenta arrow.
You can also enter the angle
directly in the field Angle.
3. In Light level (C) section, select the light level you want to use.
4. In Parameters (D) section, enter the Histogram tool parameters (see below § 7.5.2.1 Histo-
gram parameters).
5. Click Test (E) button to test the Histogram tool and display the results (see below § 7.5.2.3
Histogram test).
If you need a special
equation to realign, you
can do so using the
Equations
button.
The histogram analyses all the pixels parts contained in the defined area.
B
C
A
D
E
Histogram