VI User Manual.pdf - 第306页
Production 11 - 6 Vi sion 2007 4.10 User Manual Rev 01 11.1.5.2 Scatter chart This scatter chart re presents the components d eviation of the last inspected board. Each point represen ts a com- ponent. You can click on e…
Production
Vision 2007 4.10 User Manual Rev 01 11 - 5
I Table chart
J Average: Indicate the average and +/- 3 standard deviation of
the X, Y and Theta deviation for all the components of the last
inspected board. You can click on each bar to see the exact
value in the opposite box.
K SPC buttons
L Board No: count the number of boards inspected by the AOI system.
Average and Standard deviation: indicates the average and standard deviation of the com-
ponents deviation of the last inspected board.
11.1.5.1 Command buttons
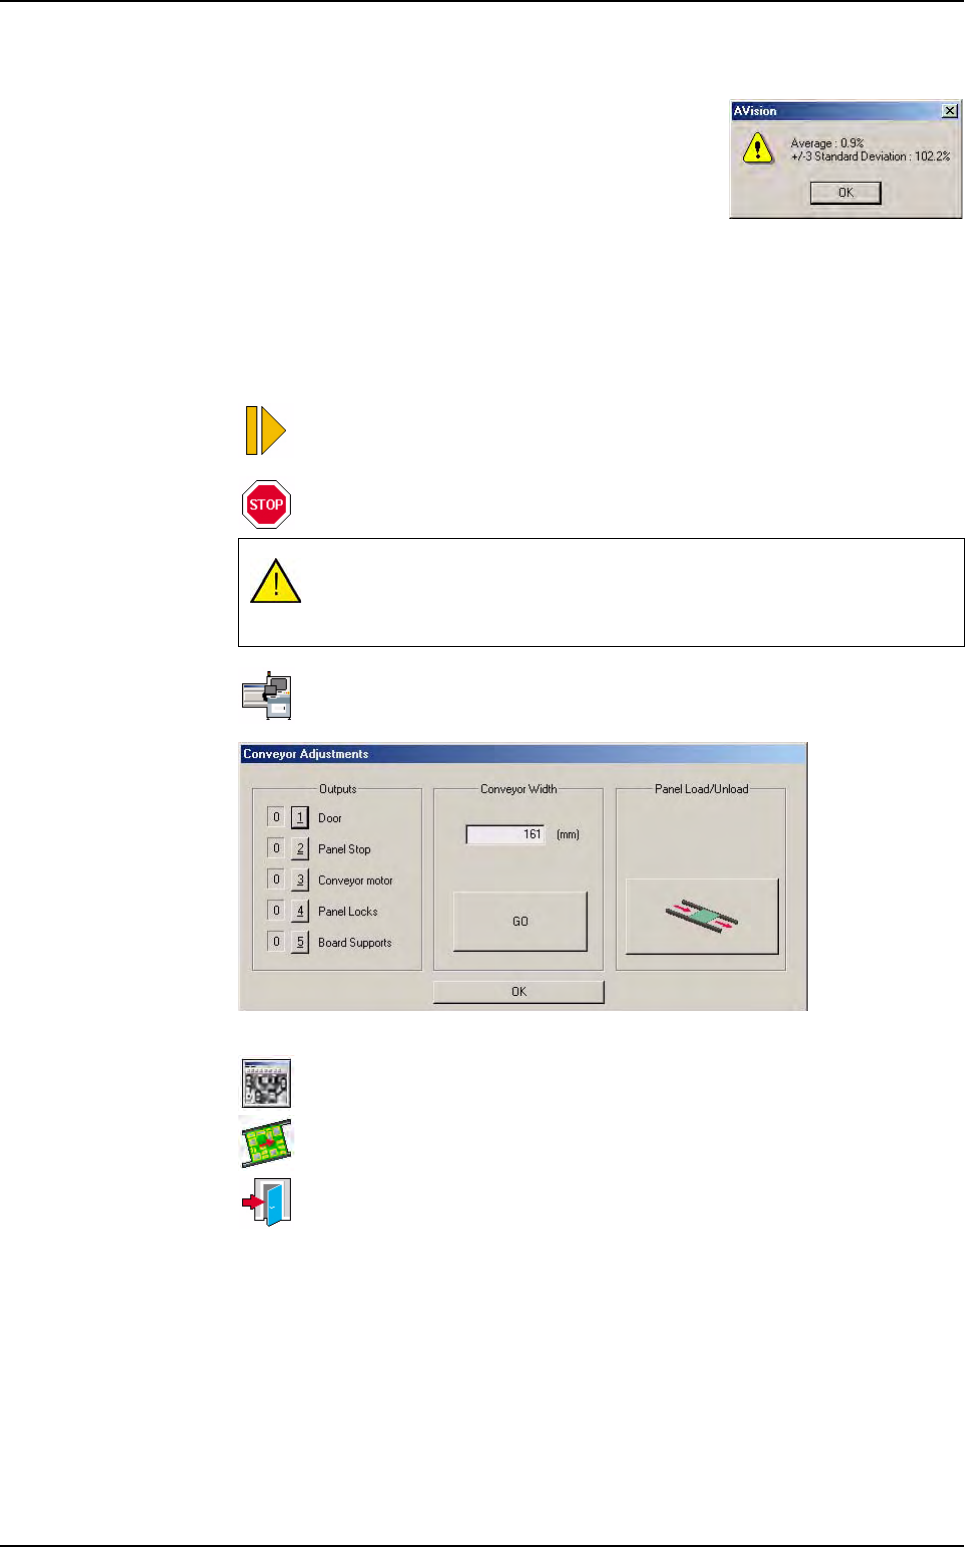
Start the production cycle: load a board, inspect it and unload the board.
Stop the production cycle.
Allows to activate some inputs and outputs of the AOI system with the win-
dow below.
Open the Cognex console to see the pictures acquired by the camera for the
fiducials inspection.
Switch from Passthrough mode to Production mode.
Close Production mode and go back to Vision 2006 main screen. This
menu is only available when the production is stopped.
You can not stop while a board is inspected. If you press Stop while a
board is inspected, the production will stop after the board has been re-
leased from the machine.
Production mode
Production
11 - 6 Vision 2007 4.10 User Manual Rev 01
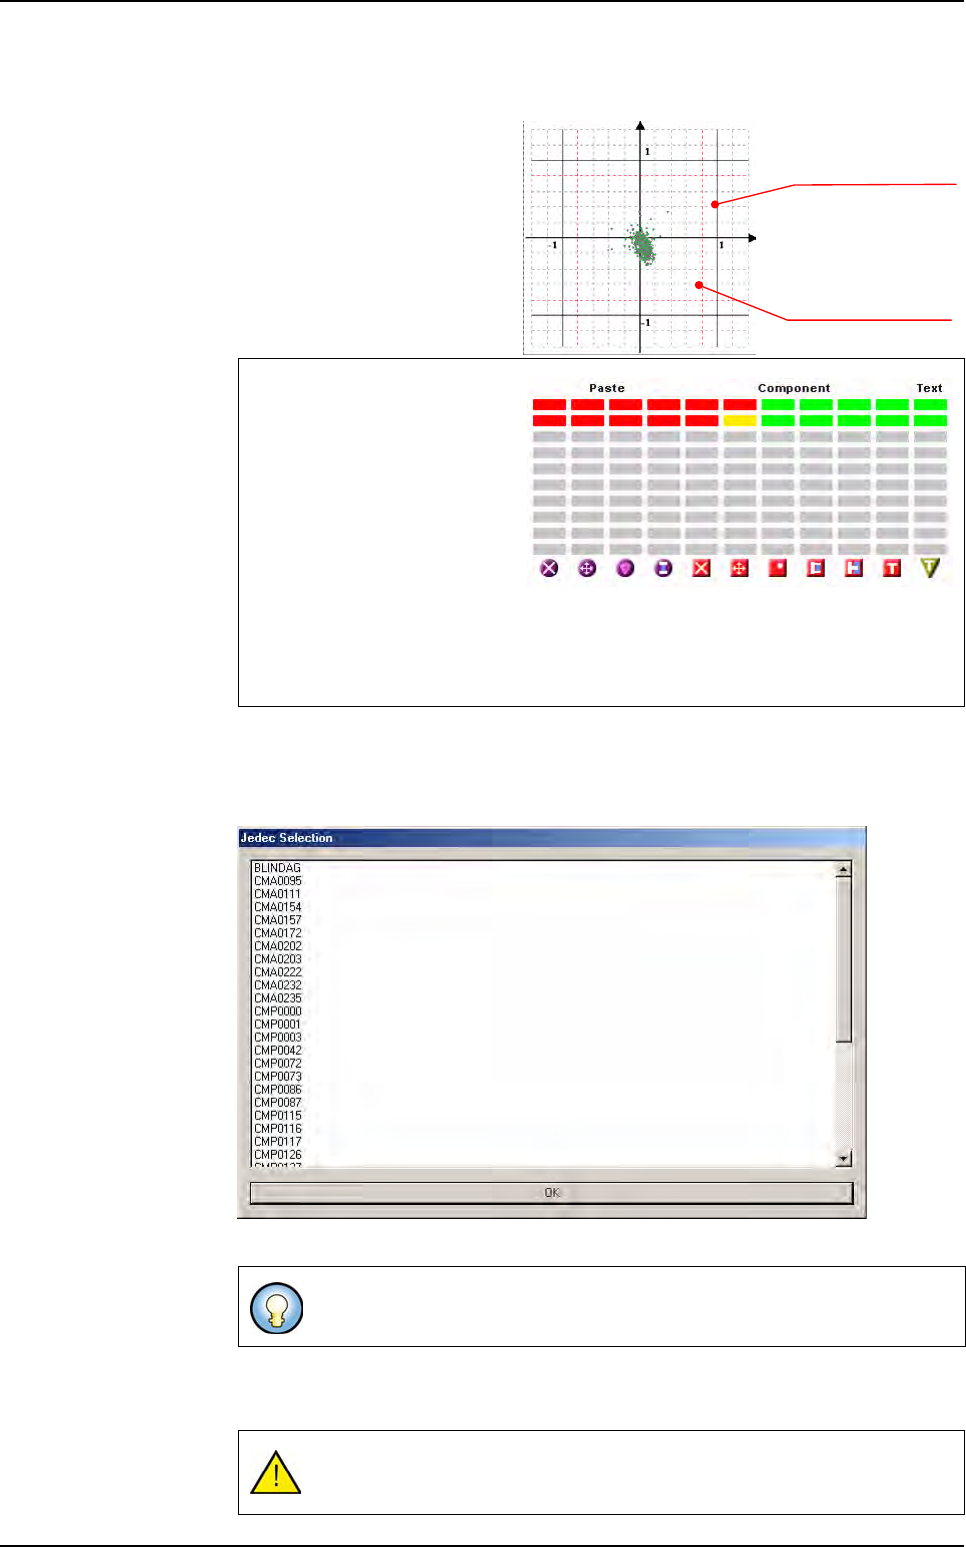
11.1.5.2 Scatter chart
This scatter chart represents
the components deviation of
the last inspected board.
Each point represents a com-
ponent.
You can click on each point to
access the component inspec-
tion result.
11.1.5.3 Display selection buttons
All points display all the components.
Jedec select among the Jedec list, the ones you want to be displayed in the scatter chart.
If you have filled the feeder information in the .tst file for some components, you can
access these information with Machine, Level 1, 2, 3, 4 buttons.
When a component is inside 80
% of the tolerances, it is well
placed. So it is associated to
the green color in the right table
chart.
When a component is between
80 % and 100 % of the position
tolerances, it is considered in
alarm. So it is associated to the
yellow color in the right table chart.
When a component is out of 100 % of the tolerances, it is considered in error. So it is
associated to the red color in the right table chart.
You can use Shift + Ctrl to select several Jedec.
If you have not feeder information, you will have a warning message when
clicking on any of these buttons.
Position tolerance (100%)
Position tolerance (80%)
X axis
Y axis
Production mode
Production
Vision 2007 4.10 User Manual Rev 01 11 - 7
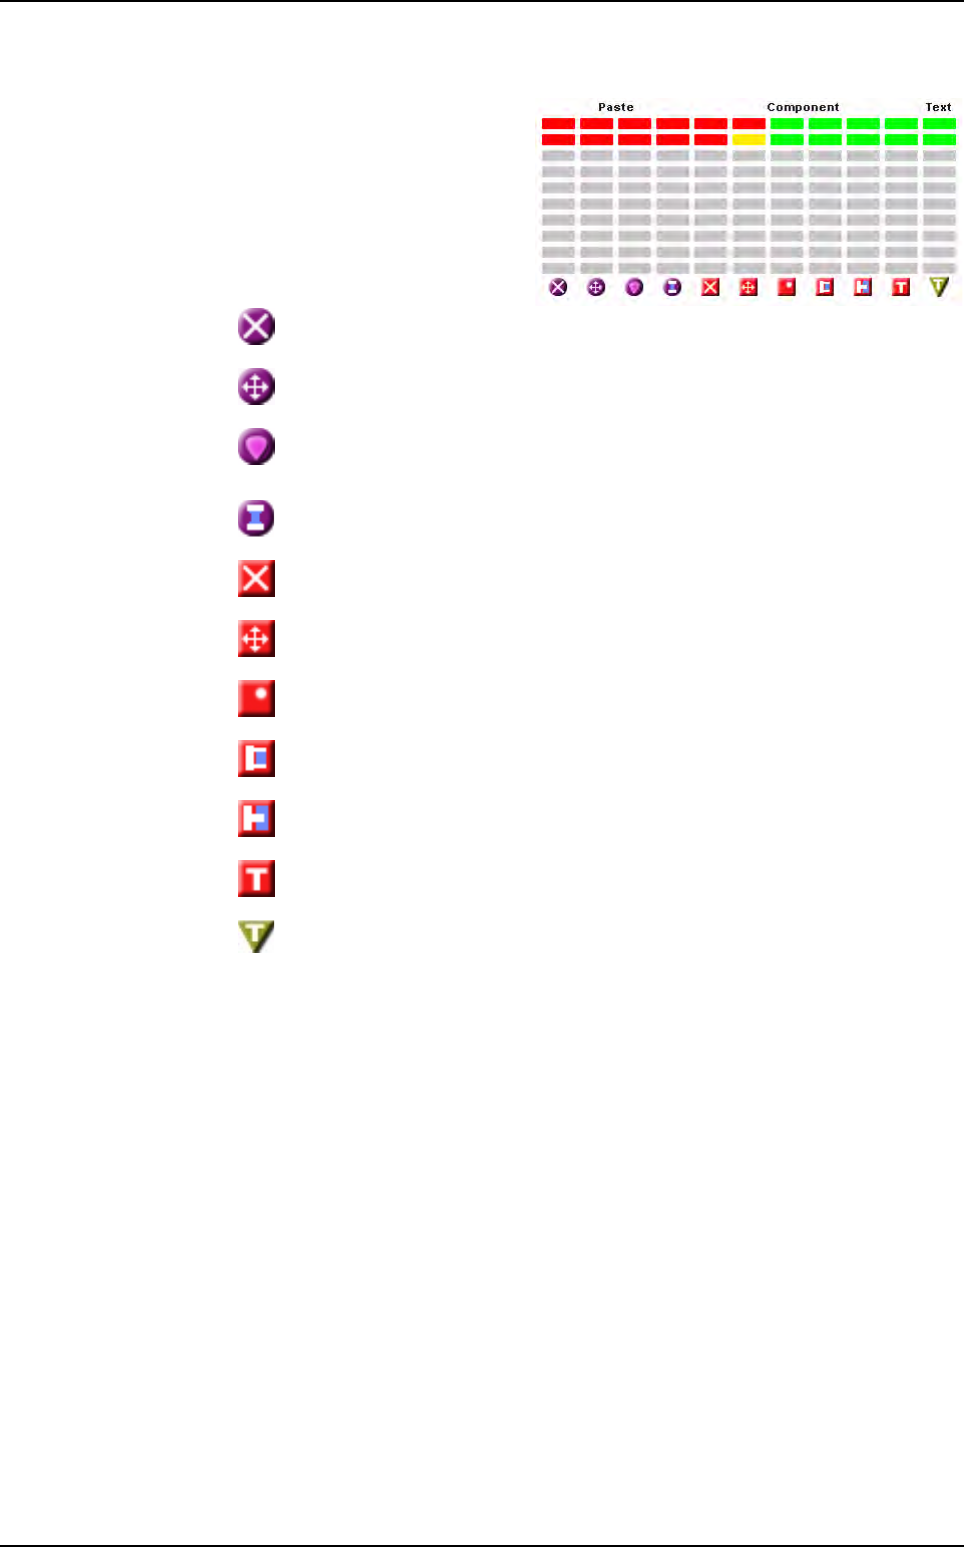
11.1.5.4 Table chart
This table chart gives a status of
the last 9 inspected boards.
Each line represents a board,
and the last inspected one is in
the upper position. Each column
represents an error type.
You can have up to 9 columns
for:
Paste
missing
Paste
position
Paste
surface
Paste
bridge
Component missing
Component position
Component polarity
Solder bridge
Solder joint
Text linked to the component missing
Text missing
Production mode