TR7500_Series_Software_v29_En.pdf - 第314页
Test Research Inc. 292 TR7500 Series User Guid e –Softwa re v.2.9.0 12.3 Results D ialog Figure 483 : Test Results Di alog [Con firm PASS] – Confir m the board passed. [Con firm FAIL] – Confirm the board f ailed. […
Test Research Inc.
TR7500 Series User Guide –Software v.2.9.0 291
[Mono/R/G/B] – Let the image in the multi-function window display according to the
setting.
[Prev/Next] – Go to the next or previous failed FOV.
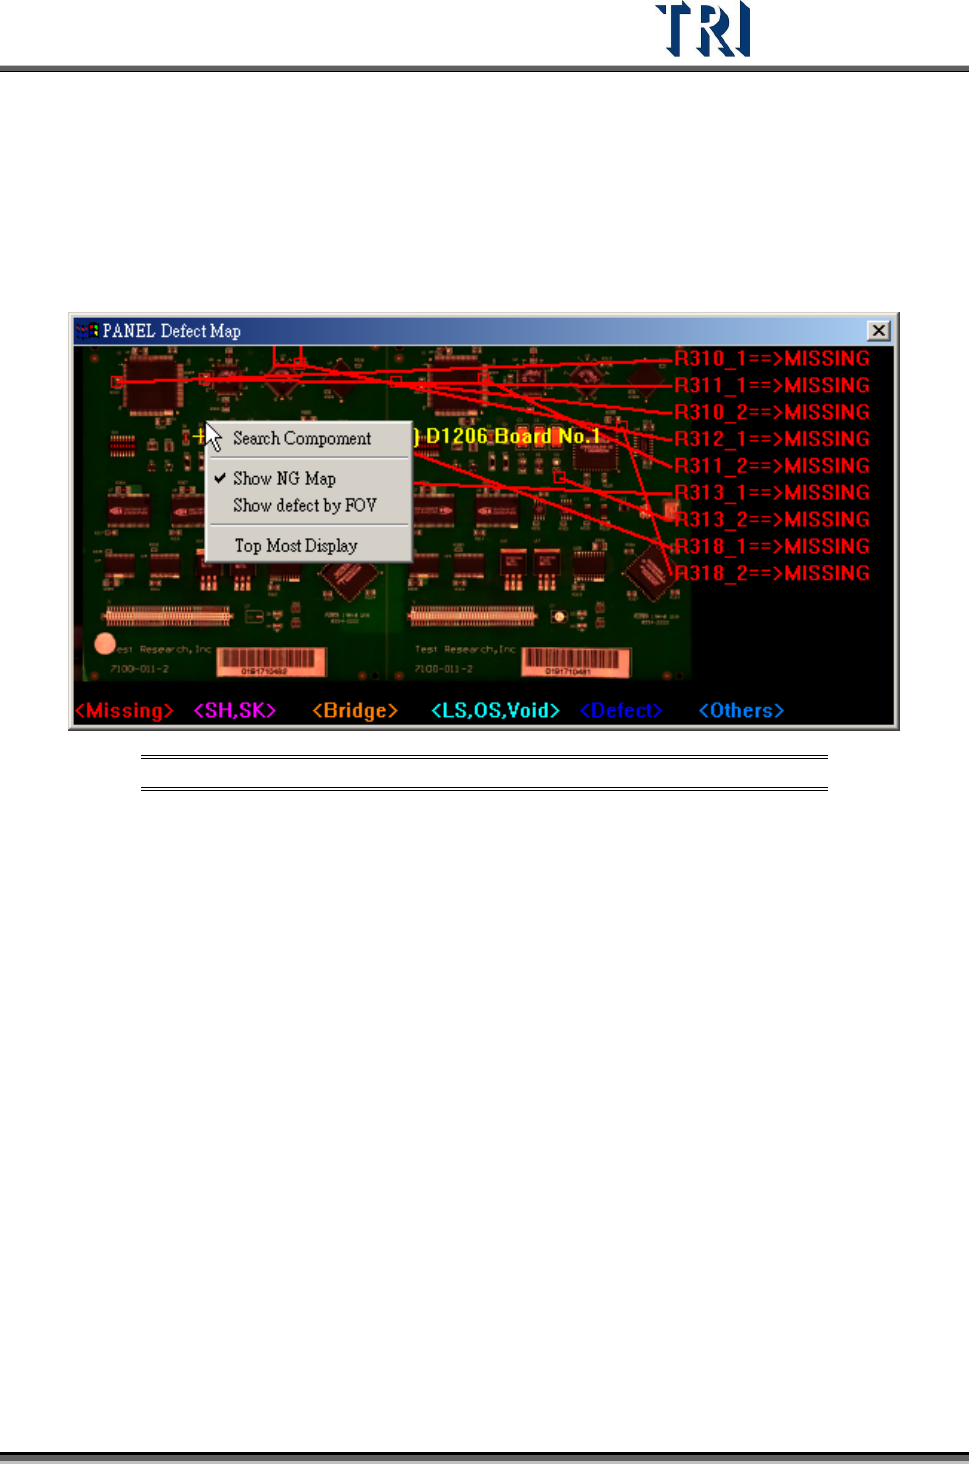
12.2 Panel Defect Map
Right click on the map, then the following pop-up menu will display.
Figure 482: Panel Defect Map
[Search Component] – Select this button, then specify a component to be marked
on the map.
[Show NG Map] – Checking this item displays the panel defect map after the next
inspection; otherwise, the map will not display after the next inspection.
[Show defect by FOV] – The system will display all defects on the panel when this
item is not selected. When selected, the system will only display the defects that
are reviewed in the [Results] dialog.
[Top Most Display] – When the item is selected, this [Panel Defect Map] will be
displayed at the top from the next inspecting.
Test Research Inc.
292 TR7500 Series User Guide –Software v.2.9.0
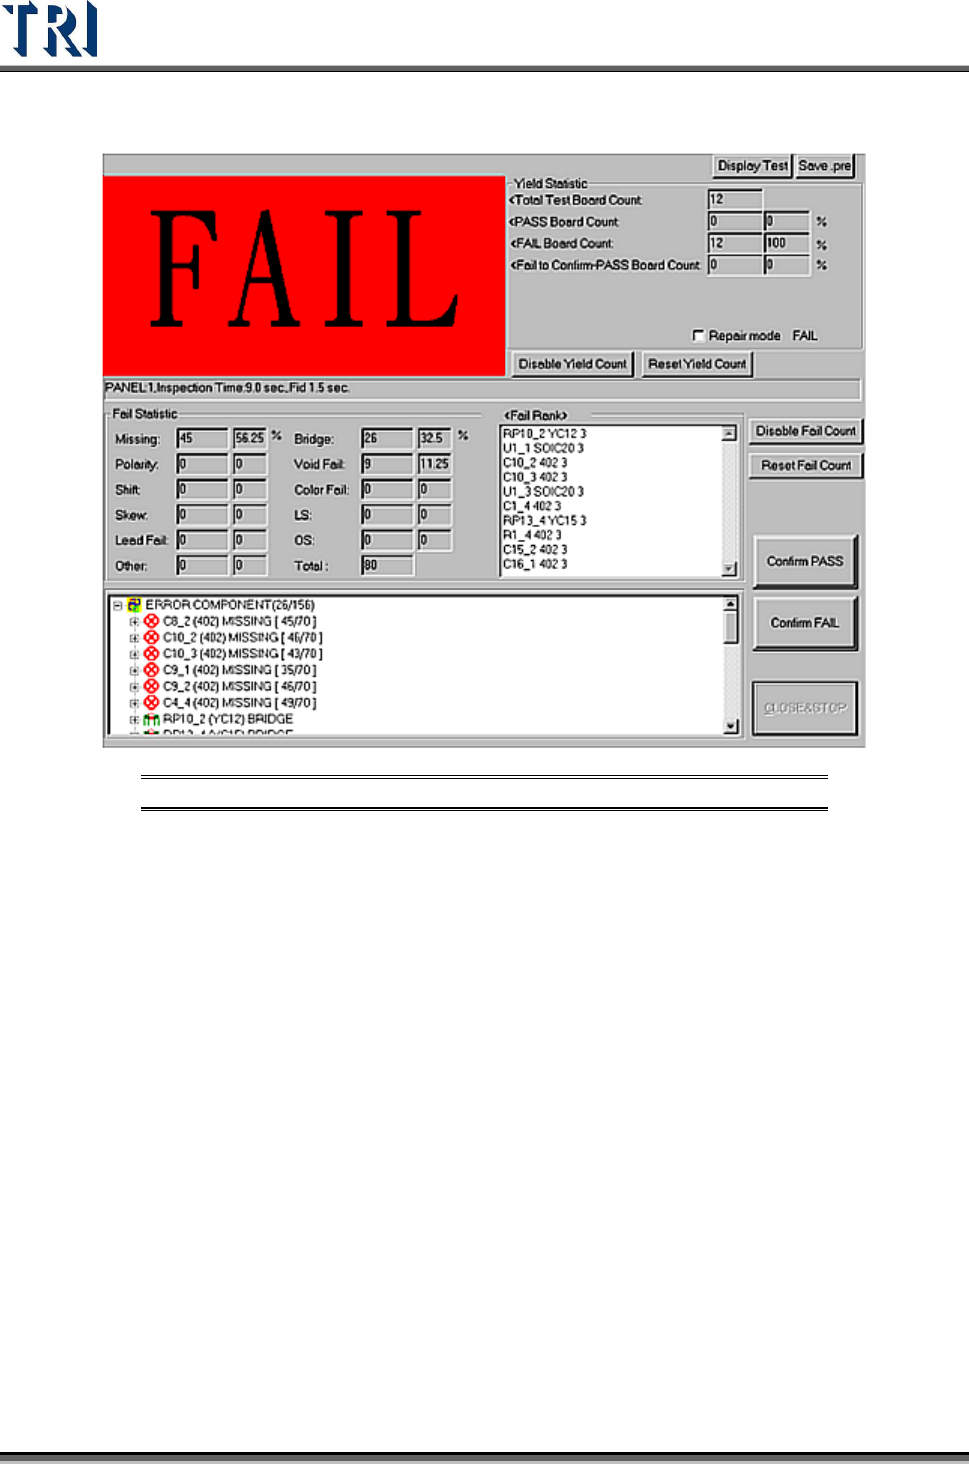
12.3 Results Dialog
Figure 483: Test Results Dialog
[Confirm PASS] – Confirm the board passed.
[Confirm FAIL] – Confirm the board failed.
[Display Test/Display Fail] – Select whether to display [TEST] or [PASS] and [FAIL]
figure.
[Save .pre] – Save the project
[Yield Statistic] – List the result counts of board.
[Total Test Board Count] – Total test board count, counting with the single board.
[PASS Board Count] – Total PASS board count.
[FAIL Board Count] – Total FAIL board count.
[Fail-to Confirm-PASS Board Count] – The number of boards that are tested
FAIL but are confirmed as PASS by operator.
[Repair mode] – Select to link with Repair Station and display the data that is
confirmed and calculated on Repair Station. Note: For Repair Station,
[Setting/Other/SPCOutPut] has to be set as [True]. It shows the DPMO field,
only when you confirm the data by Window on Repair Station.
Test Research Inc.
TR7500 Series User Guide –Software v.2.9.0 293
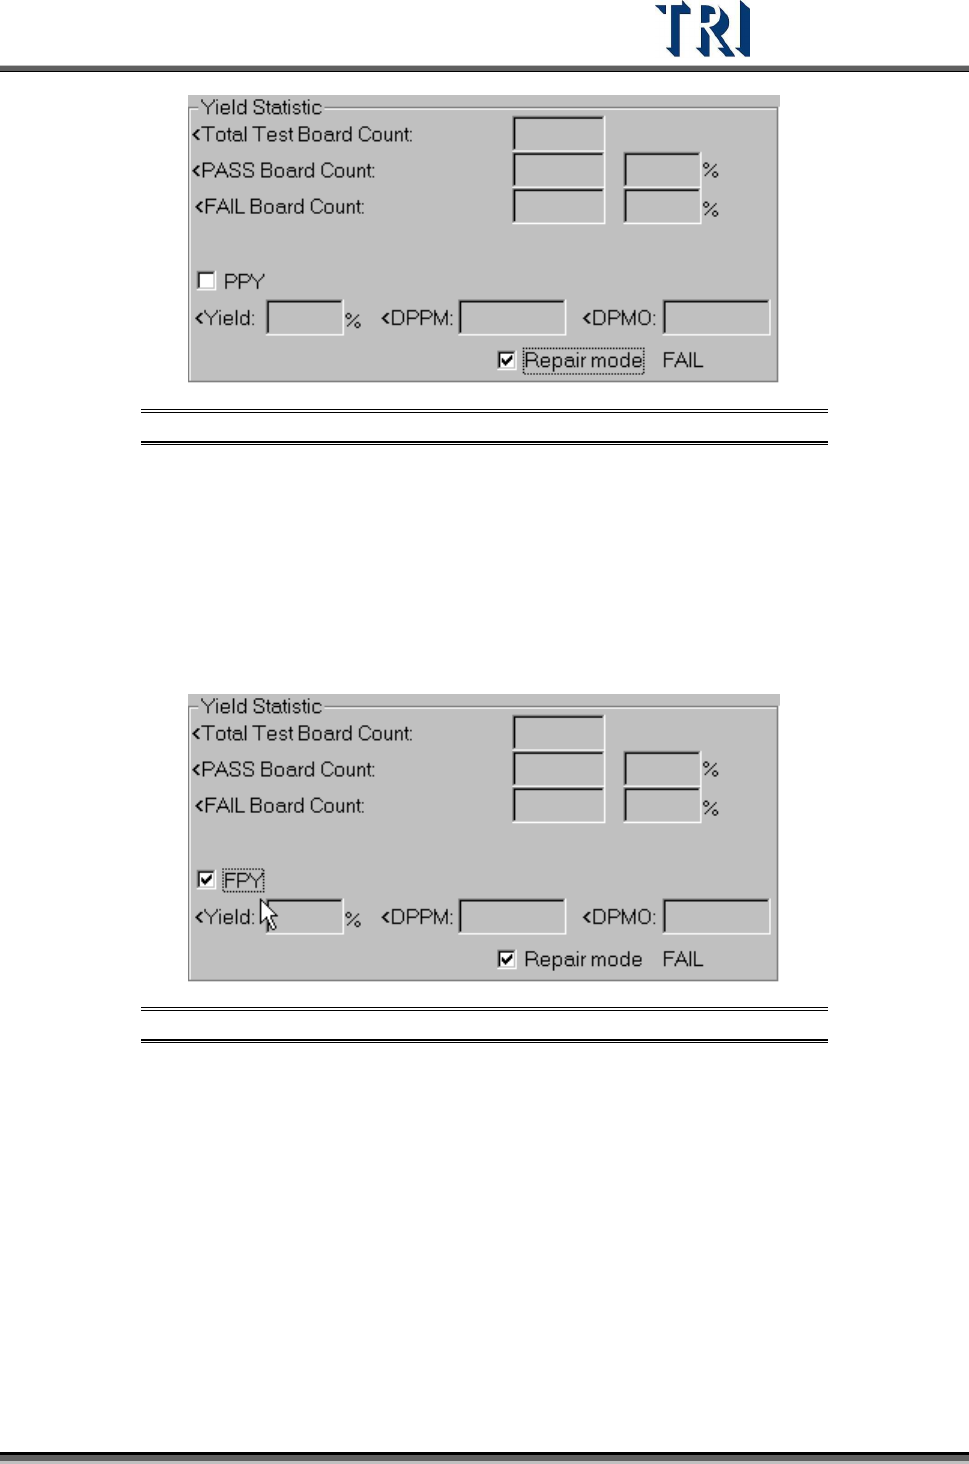
Figure 484: PPY Defect Statistics
[PPY Yield] – (Board confirmed PASS Count + Board that is false alarm Count)/
(Total Test Board Count) *100%
[PPY DPPM] – [(Component confirmed FAIL Count + Component that is false
alarm Count) / (Total Component Count)]*1000000
[PPY DPMO] – [(Inspection Box confirmed FAIL Count + Inspection Box that is
false alarm Count)/(Total Test Board Count*Total Inspection Box
Count)]*1000000
Figure 485: FPY Defect Statistics
FPY Yield – Board confirmed PASS Count /Total Test Board Count *100%
FPY DPPM – [(Component confirmed FAIL Count)/Total Component
Count]*1000000
FPY DPMO – [(Inspection Box confirmed FAIL Count)/(Total Test Board
Count*Total Inspection Box Count)]*1000000
Inspection time – Display inspection counts, inspection time and time to finding
fiducial marks.
Fail Statistic – List the rank of failed components and the defect counts.
Defect tree – List the details of components.