TR7500_Series_Software_v29_En.pdf - 第85页
Test Research Inc. TR7500 Series User Guide – Software v.2.9.0 63 Figure 112 : Sample Pass Lev el Graph Select a type on the t able and the infor m ation of the type w ill be listed in [Info.] area. The meanings are: […
Test Research Inc.
62 TR7500 Series User Guide –Software v.2.9.0
3.4.3.1 By Component Type
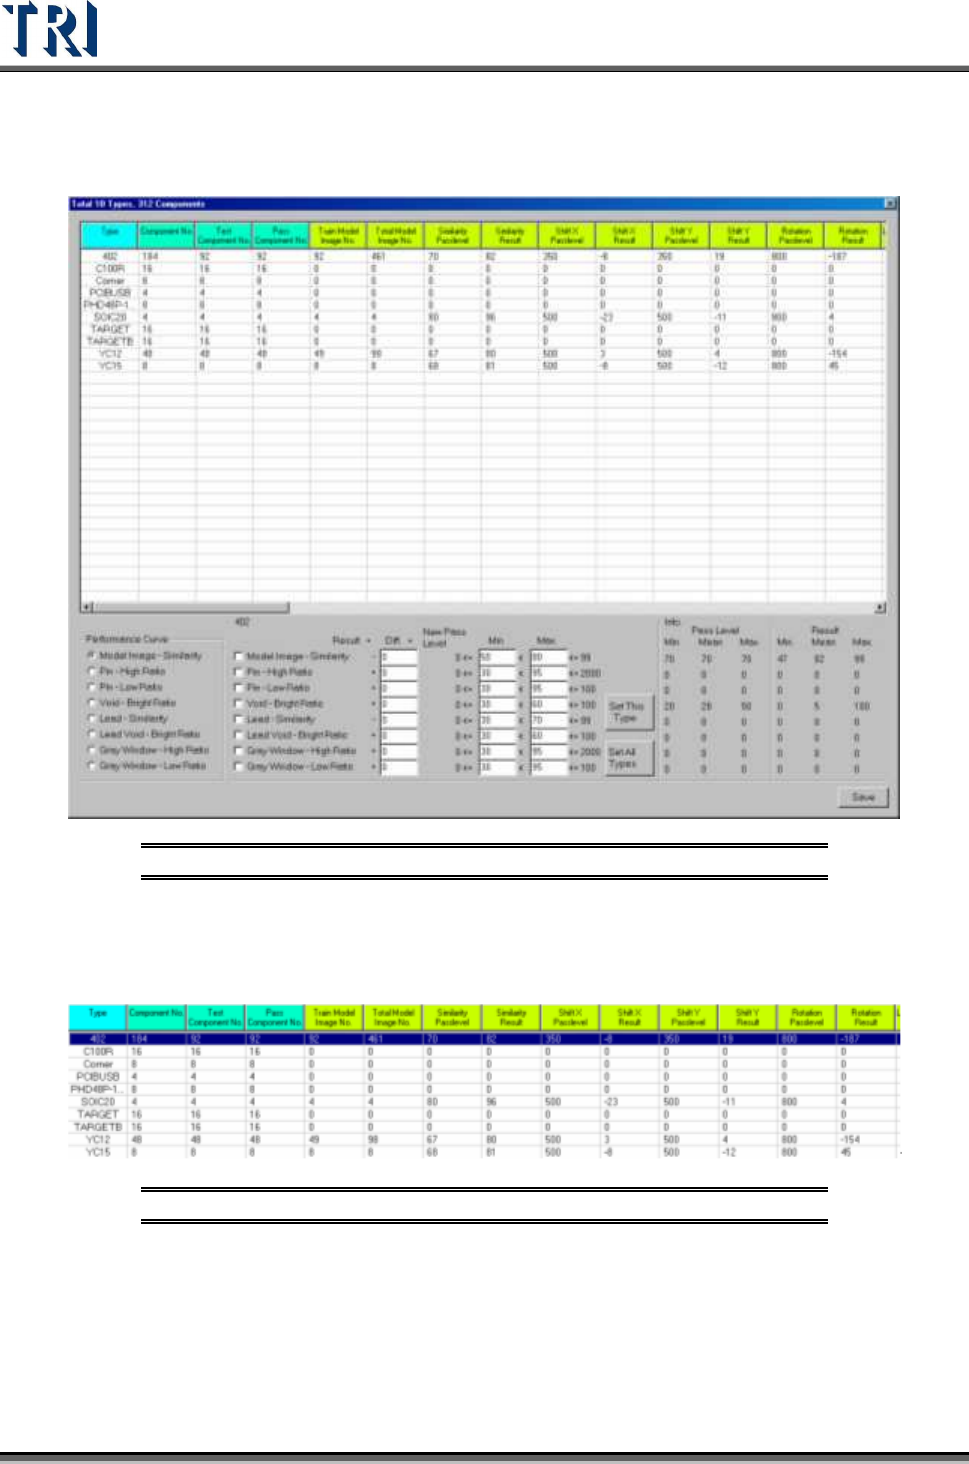
Set the pass level by component type. After selection the following window appears.
Figure 110: Sample Component List
In the table the first four columns display the component information and the following
columns show the information of different inspection boxes. Double click on the inspection
result cell to edit the pass level.
Figure 111: Four Fields to Edit in Component List
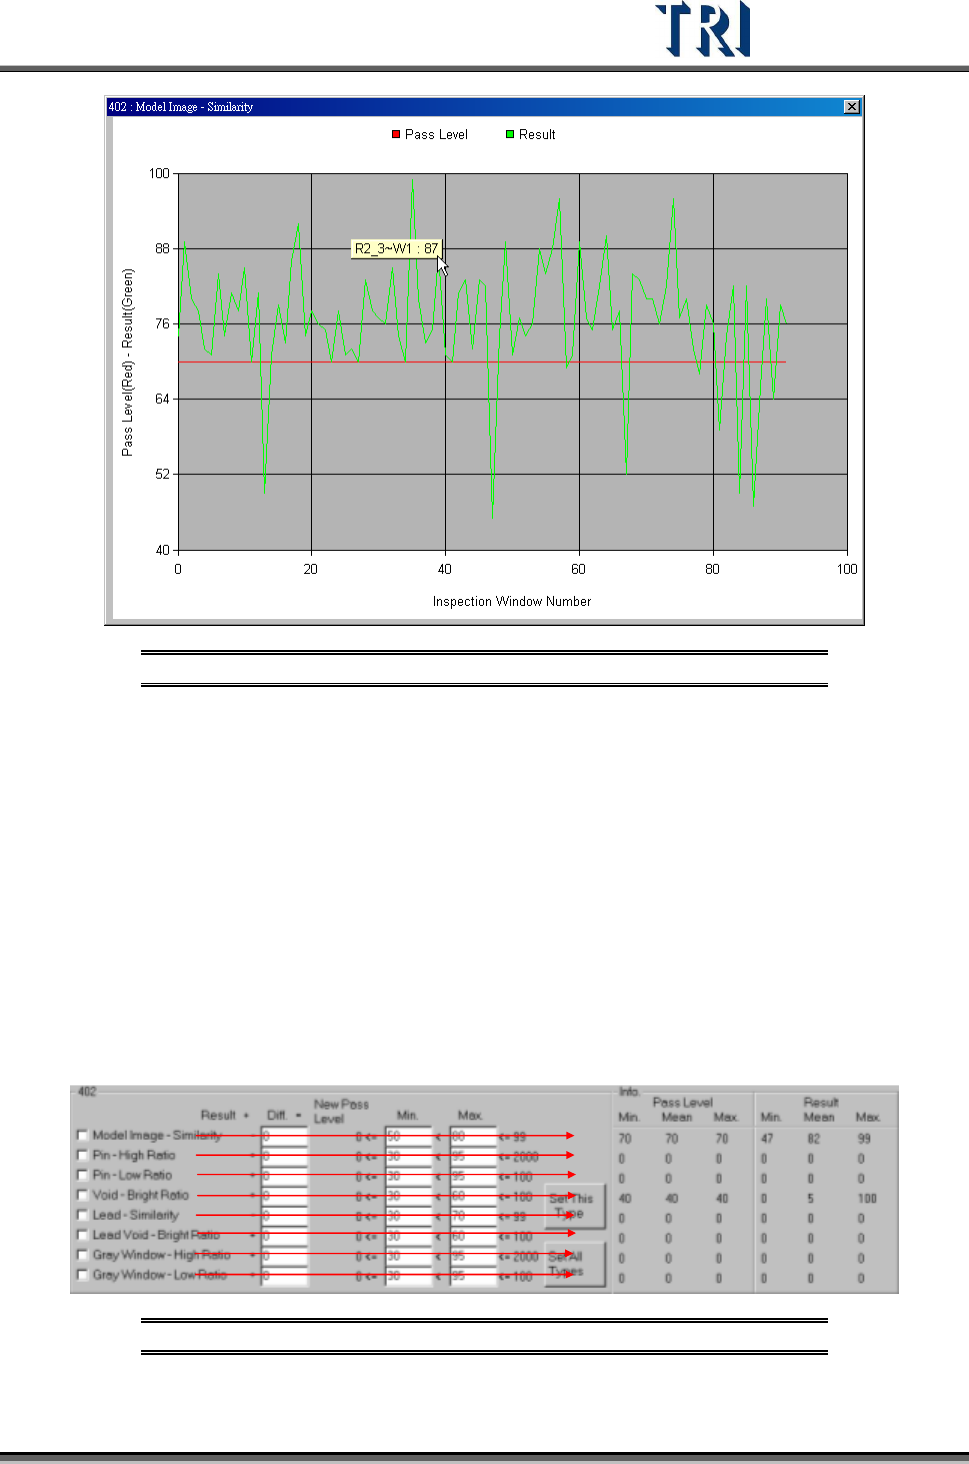
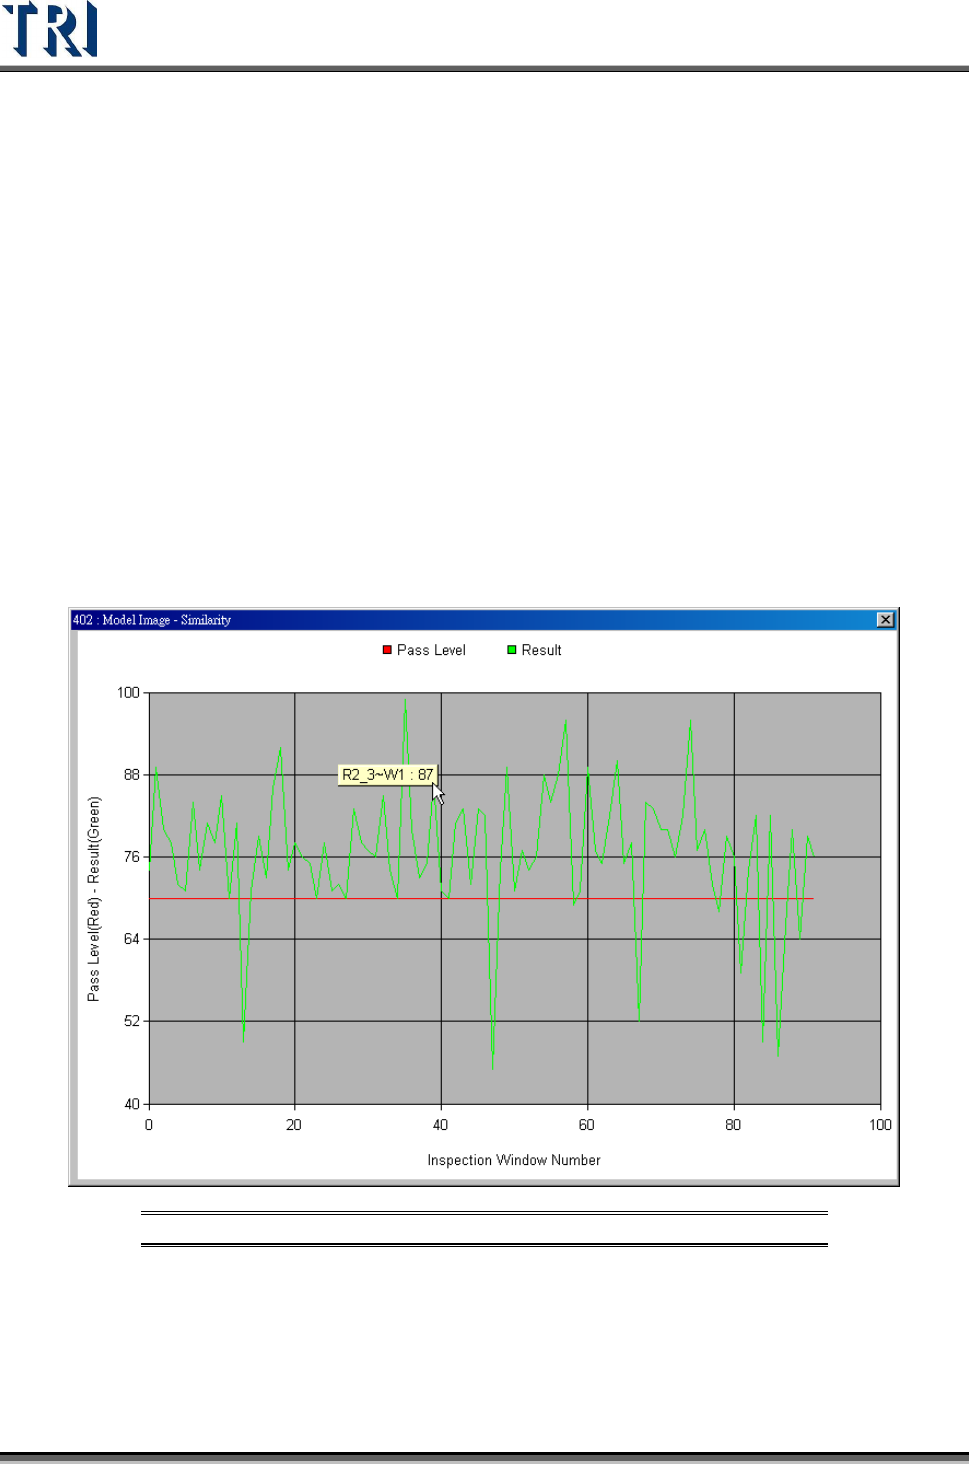
Select a kind of inspection box in [performance curve] and double click on the type name in
table then it will show the result of all components in this type. The horizontal axis is for every
component and the vertical axis means the score. The green points mean the average result
of every component and the red points mean the pass level of every component. Click to
show the component name and score.
Test Research Inc.
TR7500 Series User Guide –Software v.2.9.0 63
Figure 112: Sample Pass Level Graph
Select a type on the table and the information of the type will be listed in [Info.] area. The
meanings are:
[Pass Level Min.] – The minimum of pass level for all components in the selected
type.
[Pass Level Mean] – The average of pass level for all components in the selected
type.
[Pass Level Max.] – The maximum of pass level for all components in the selected
type.
[Result Min.] – The minimum of result for all components in the selected type.
[Result Mean] – The average of result for all components in the selected type.
[Result Max.] – The maximum of result for all components in the selected type.
Figure 113: Detailed Component Information
Test Research Inc.
64 TR7500 Series User Guide –Software v.2.9.0
Check the kind of inspection boxes then press [Set This Type] or [Set All Types] to change
the parameters following the conditions.
Check boxes – Check the parameter you want to set.
[Diff] – Input the number you want to increase or decrease. The system will add or
subtract the number from the average result for all components and set the number
as new pass level.
[Min., Max] – Give new parameter a range in order not to create an unsuitable
value. If the calculated parameter is smaller than [Min.] value the system will modify
the parameter as [Min.] value; if the calculated parameter is bigger than [Max.]
value the system will modify the parameter as [Max.] value.
[Set This Type] – Calculate the checked parameters to selected type.
[Set All Types] – Calculate the checked parameters to all types.
Take [Model Image-Similarity] of 402 for example. The steps are as follows.
Check [Model Image-Similarity]
Take [Performance Curve] and [Info.] area for reference and decide the new difference.
Figure 114: Example: Model Image - Similarity