TR7500_Series_Software_v29_En.pdf - 第88页
Test Research Inc. 66 TR7500 Series User Guide – Software v.2.9.0 3.4.3.2 By Component Na me Choosing this item displa ys the component list window . T he window lists all pass levels and inspection results for every com…
Test Research Inc.
TR7500 Series User Guide –Software v.2.9.0 65
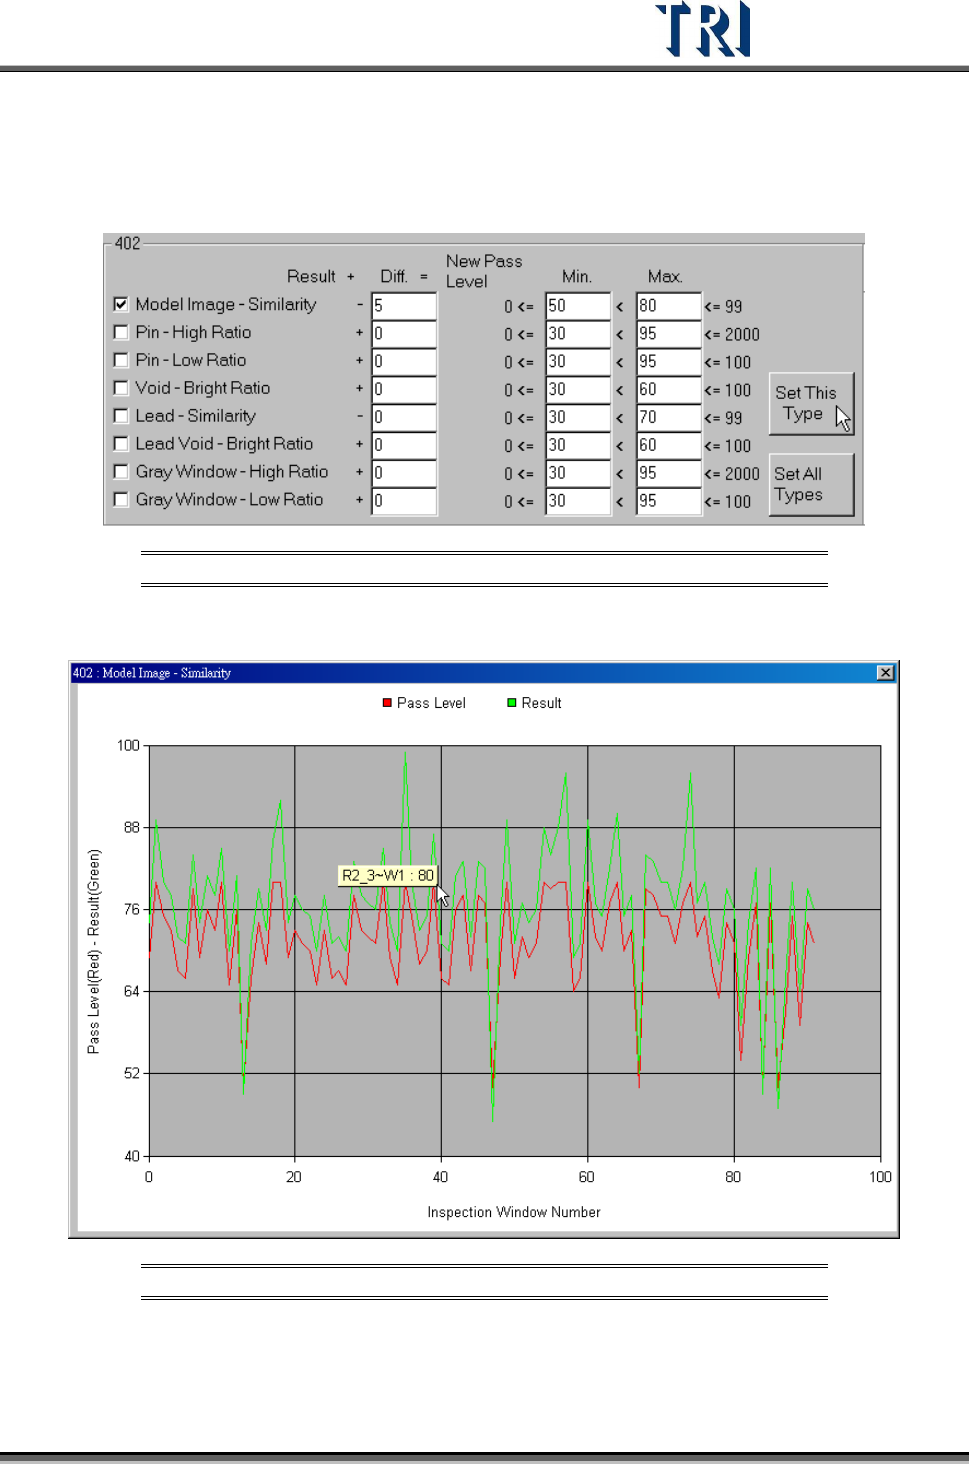
Input 5 in [Diff.] field and press [Set This Type]. The system will subtract 5 from the
average of every component in [402] type separately. The result will be set as the
new pass level.
Figure 115: Example: Changing Component Pass Level
Look at the curve again to review the change.
Figure 116: Example: Model Image – Similarity with New Pass Level
[Save] – Press to save the table as a text file. The file name is [typeSetting.txt].
Test Research Inc.
66 TR7500 Series User Guide –Software v.2.9.0
3.4.3.2 By Component Name
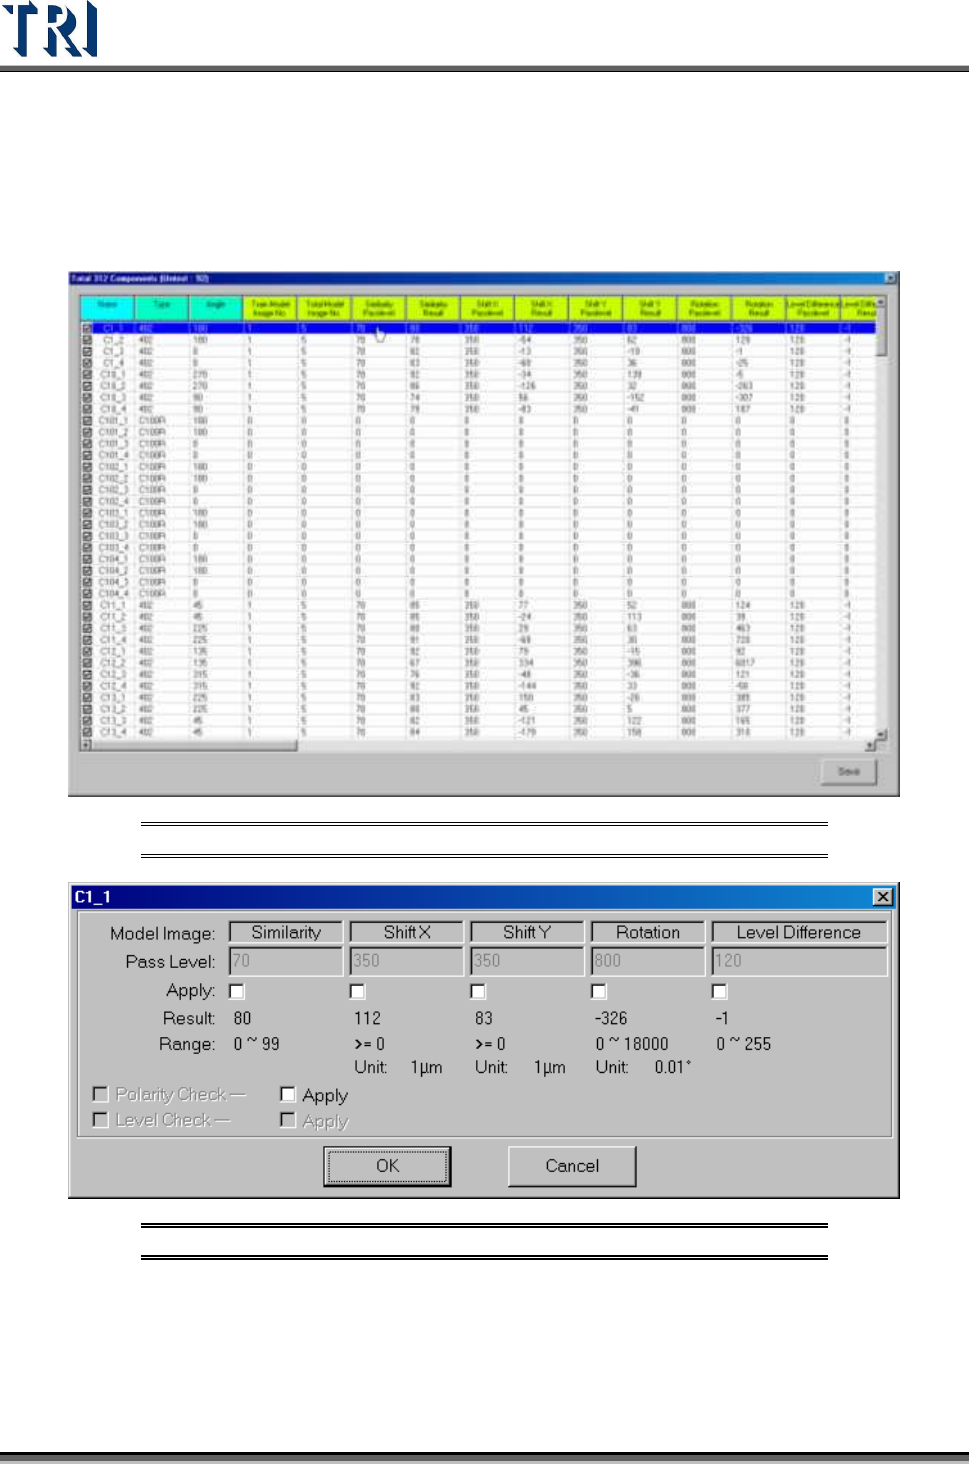
Choosing this item displays the component list window. The window lists all pass levels and
inspection results for every component. 0 means the component does not have that kind of
inspection box. Double click on the object component to change the parameters. Check or
uncheck the square item to test or untest the component.
Figure 117: Component List Window
Figure 118: Model Image Pass Levels
Test Research Inc.
TR7500 Series User Guide –Software v.2.9.0 67
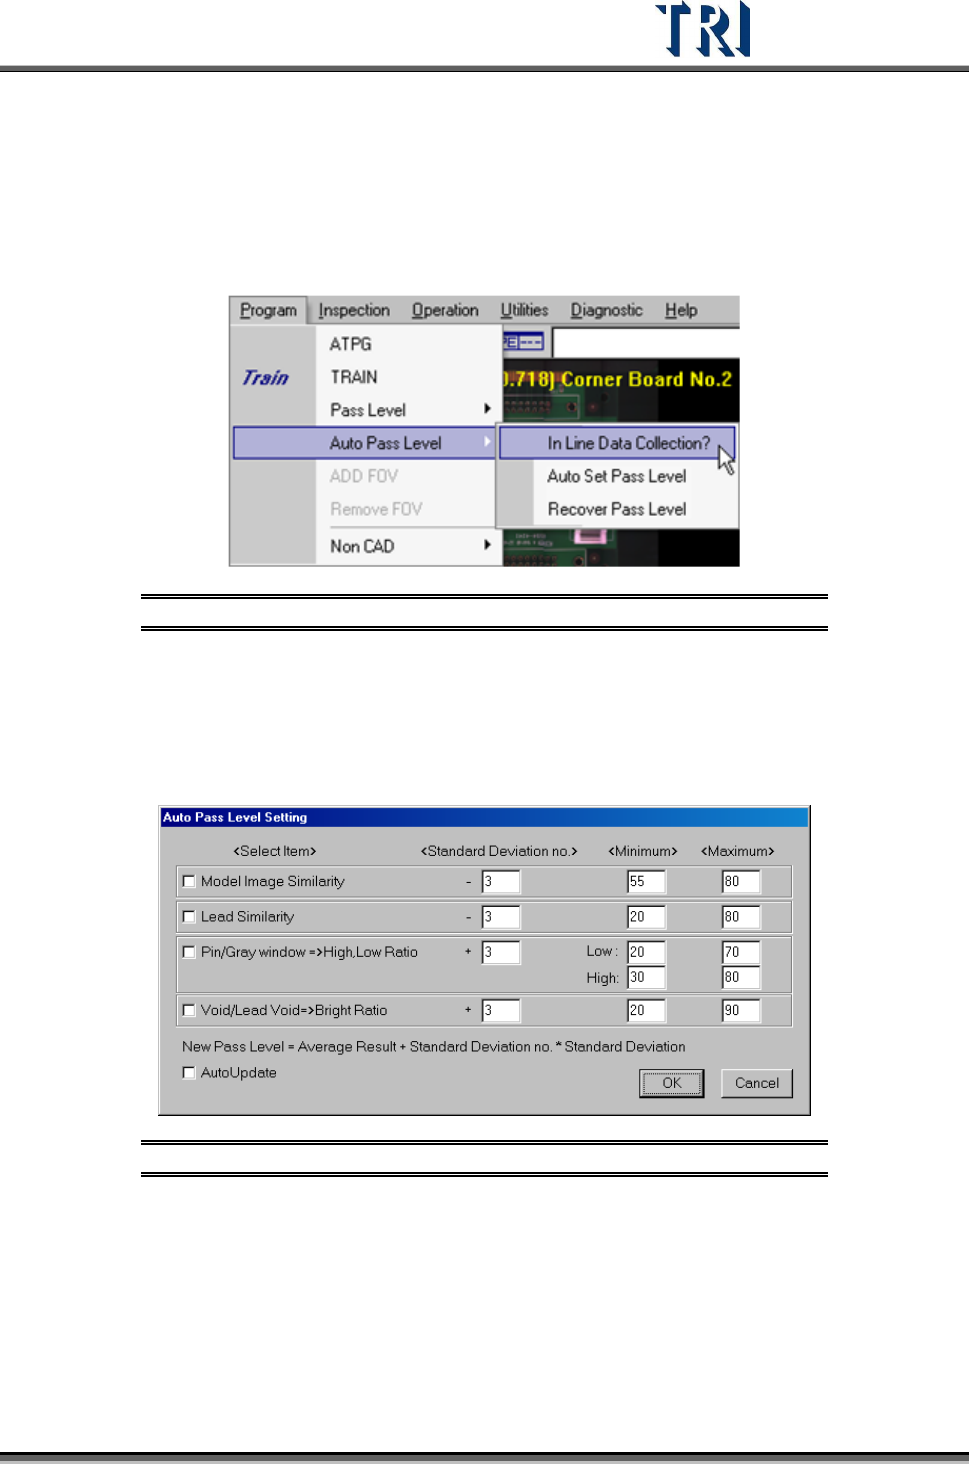
3.4.4 Auto Pass Level
3.4.4.1 Inline Data Collection
Select to start the data collection and the data collection can be the basis of auto pass level.
The system saves the most recent 30 data values and only the passed value will be
calculated.
Figure 119: Program –Auto Pass Level
3.4.4.2 Auto Set Pass Level
The system will recalculate the new pass level according to the 30 data and the setting here.
Select the inspection boxes and input [Standard Deviation no.], [Minimum] and [Maximum]
then press [Ok] to change the pass level.
Figure 120: Auto Pass Level Setting
[Select Item] – Select the inspection boxes to change.
[Standard Deviation no.] – Set a multiple of standard deviation to calculate
parameters. New pass level = Average Result +Standard Deviation no.* Standard
Deviation. The [Average Result] and [Standard Deviation] is calculated from 30
times results.
[Minimum, Maximum] – Give new parameter a range in order not to create an
unsuitable value. If the calculated parameter is smaller than [Min.] value the system