YRM20_Ope_E.pdf - 第124页
3. Displaying the production monitors 2-27 Chapter 2 Basic operation 3.2 Main T he [Monitor] - [Main] tab screen shows y ou the real-time production status such as the board count and cycle time. Displa ying this screen …
3. Displaying the production monitors
2-26
Chapter 2 Basic operation
3. Operating Navigation area (operating instruction message area)
• Operating Navigation instructions
This displays messages with countermeasures for handling errors, operating instructions or warnings
at operating position selected with the "Select Operating Position" drop-down list. When multiple
errors occur, those items with the highest priority for countermeasures are displayed in sequence. To
switch to other instruction messages, press the left/right arrow buttons.
• Select Operating Position drop-down list
If the machine is experiencing errors at more than one location, select the location to check from the
drop-down list. Note that the drop-down list shows only positions that require operator task.
TIP
Errors are also displayed in the graphic layout view on the upper part of the screen.
The operating position can be selected by clicking the error area on the graphic layout view. However, the operating
position cannot be selected if clicking an area where there are no errors or operating instructions.
• [Error Detail] button
Pressing this button displays an error message screen that contains detailed information and
countermeasures for the error and operating instruction, or warning displayed in the "Operating
Navigation" area.
• [Error Clear] button
Press this button after recovering from the error or after handling the operating instruction or warning
displayed in the "Operating Navigation" area. Pressing this button shows that recovery is complete
by following the message in the "Operating Navigation" area, and that automatic operation can
restart. However, automatic operation will not restart if a recovery task is still incomplete.
TIP
If an error has occurred that affects the entire machine, the entire background area is displayed in blue.
4. Component information display area
Displays basic information on components currently being used in the program (board data) for
production. Data that is causing an error appears in a different color.
• [Option] button
Switches the "part details" area display ON and OFF.
3. Displaying the production monitors
2-27
Chapter 2 Basic operation
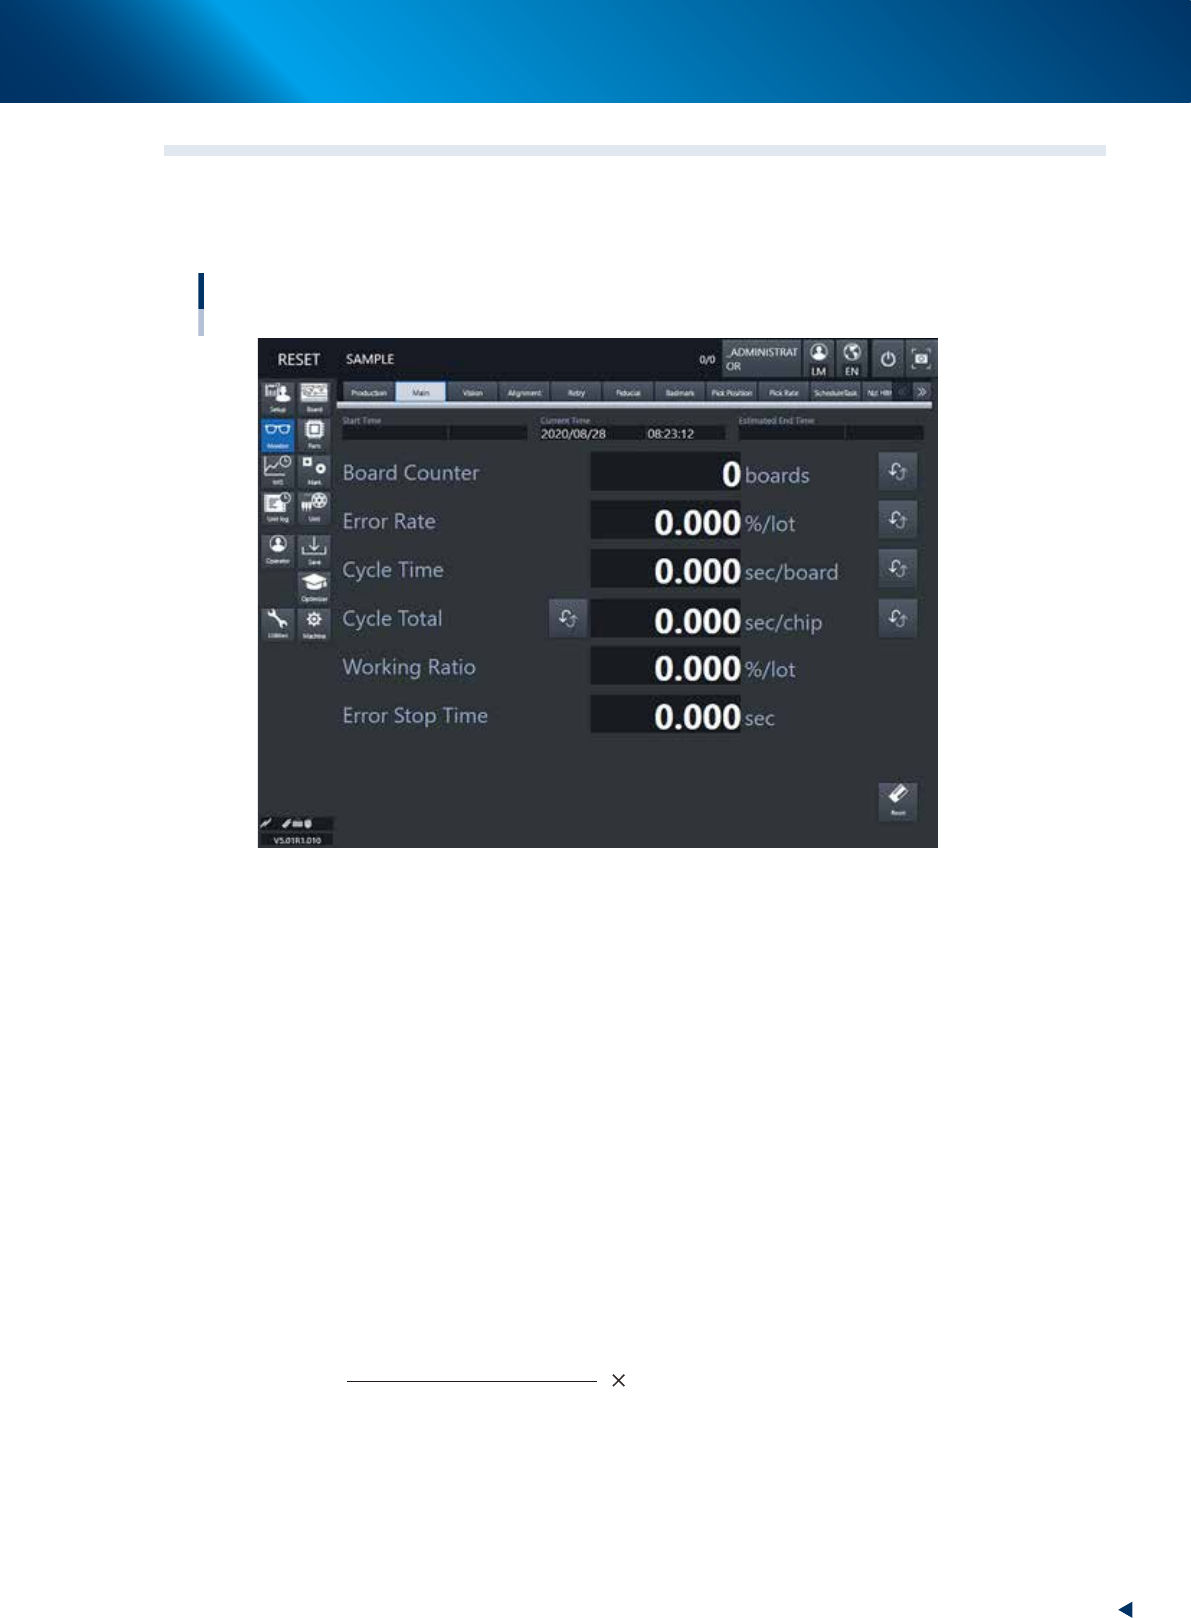
3.2 Main
The [Monitor] - [Main] tab screen shows you the real-time production status such as the board count and
cycle time. Displaying this screen during production is handy. All information will be cleared when the
board type is changed.
Monitor: Main
24213-KMX-00
• Start Time
Displays the date and time that the board data currently being produced was changed.
• Estimated End Time
Displays the estimated time of finishing the production.
• Current Time
Displays the current date and time of the system clock time built-in the machine.
• Board Counter
The board counter displays the number of boards produced after changing to the current production
board data. The board counter counts only the boards completed the mounting. Pressing the button on
the right side allows to switch between “Board Counter” and “Block Counter”.
• Error Rate
The ratio of components discarded due to the pick up error or recognition error occurred from the time
of changing to the board data currently producing to present to all the consumed components. This data
is updated when changing the production board.
Number of discarded components
Total component consumption
Error rate (%) = 100
Pressing the button on the right allows to switch between “Error Rate” and “Pickup Rate (= 100% - Error
Rate)”.

3. Displaying the production monitors
2-28
Chapter 2 Basic operation
• Cycle Time (sec/board)
The cycle time shows the average (seconds/board) of the mounting time per board. The data is updated
when the mounting is completed.
Pressing the button on the right allows to switch among “Cycle time”, “Mount CT (cycle time)” and
“Transfer CT (cycle time)”. The Cycle Time = Mount CT + Transfer CT.
The Mount CT (cycle time) includes the board mark recognition time such as fiducial bad marks,
component recognition time, mounting time, retry operation time, component discarding time and
nozzle changing times. The stopping time due to an error and the [Stop] button is not included.
• Cycle Time (sec/chip)
Shows the time (seconds) to mount one component on the board. This is the time obtained by dividing
the time for one sequence from pickup to mounting by the number of components mounted in that
sequence.
Pressing the button on the right switches the indications among “Cycle time (sec/chip)”, “Cycle time
(sec/block)”, “Cycle time (chip/hour)”, “Cycle time (block/hour)” and “Cycle time (board/hour)”.
• Working Ratio
This is the machine's independent working ratio that is not affected by the status of the upstream and
downstream machines. The following expression calculates the working ratio.
Cumulative mounting time + cumulative transfer time
(Production completion time - setup completion time) - cumulative standby time
×
100
Working ratio (%)
=
• Cumulative mounting time : Total time that head unit is operating
• Cumulative transfer time : Total transfer time (board loading/unloading)
• Cumulative standby time : Total standby time due to upstream or downstream machine
• Production completion time : Time changed to next production board
• Setup completion time : Time [START] button was pressed and operation started
• Error Stop Time
Shows the machine stop time by error. This is a period of time until the [CLEAR] button is pressed from
the error occurrence.
• [Reset] button
This resets the production control information of the production data. It resets each piece of data
displayed on the screen, current production quantity and scheduled production quantity. The "Board
Counter" value on the Setup screen is also reset when this production data is reset.