YRM20_Ope_E.pdf - 第138页
3. Displaying the production monitors 2-41 Chapter 2 Basic operation ► "W atch-and-wait" mode The "watch-and-wait" mode is such that, if a pickup error occurs with a component, pressing the [Current C…

3. Displaying the production monitors
2-40
Chapter 2 Basic operation
• Head No.
Displays the head No. being used.
• Nozzle Type
Displays the current nozzle type.
• Head Type
Displays the method of changing the nozzle currently in use and other particulars such as automatic
nozzle change and manual nozzle change.
• Pick Rate (%)
Displays the pickup rate for each head. Rate is calculated by the following formula.
1 – ([Error count] ÷ [Number of components used]) = Pickup rate
• Nozzle MACS
Displays the nozzle MACS status.
n
NOTE
The nozzle MACS is a function that detects the position of the nozzle set up on a head to perform pickup offset correction.
Similar to the feeder MACS, this function applies to the nozzles that pick up components of 1005 or smaller.
• Center XY(mm), Offset XY(mm)
Displays the offset amounts of the nozzle MACS.
• [Current Check] button
Selecting a component (row) from among components with abnormal pickup rates (rows shown in
"red") and clicking this button sets "watch-and-wait" mode for that component.
• [All Check] button
Clicking this button sets "watch-and-wait" mode for all components with abnormal pickup rates (rows
shown in "red").
3. Displaying the production monitors
2-41
Chapter 2 Basic operation
►
"Watch-and-wait" mode
The "watch-and-wait" mode is such that, if a pickup error occurs with a component, pressing the
[Current Check] button or the [All Check] button makes the machine system memorize the pickup rate at
that point. After that, the machine indicates by the color changes whether the pickup rate improves or
worsens.
For example, after an abnormal pickup rate is stored in "watch-and-wait" mode, if the problem is
eliminated and operation resumed, and the pickup rate improves, then the color of the row(s) changes
from "pink" to "yellow" to show an improvement has been made. Conversely, if the pickup rate becomes
even worse, then the color changes from "pink" back to "red" to show the troubleshooting was
ineffective.
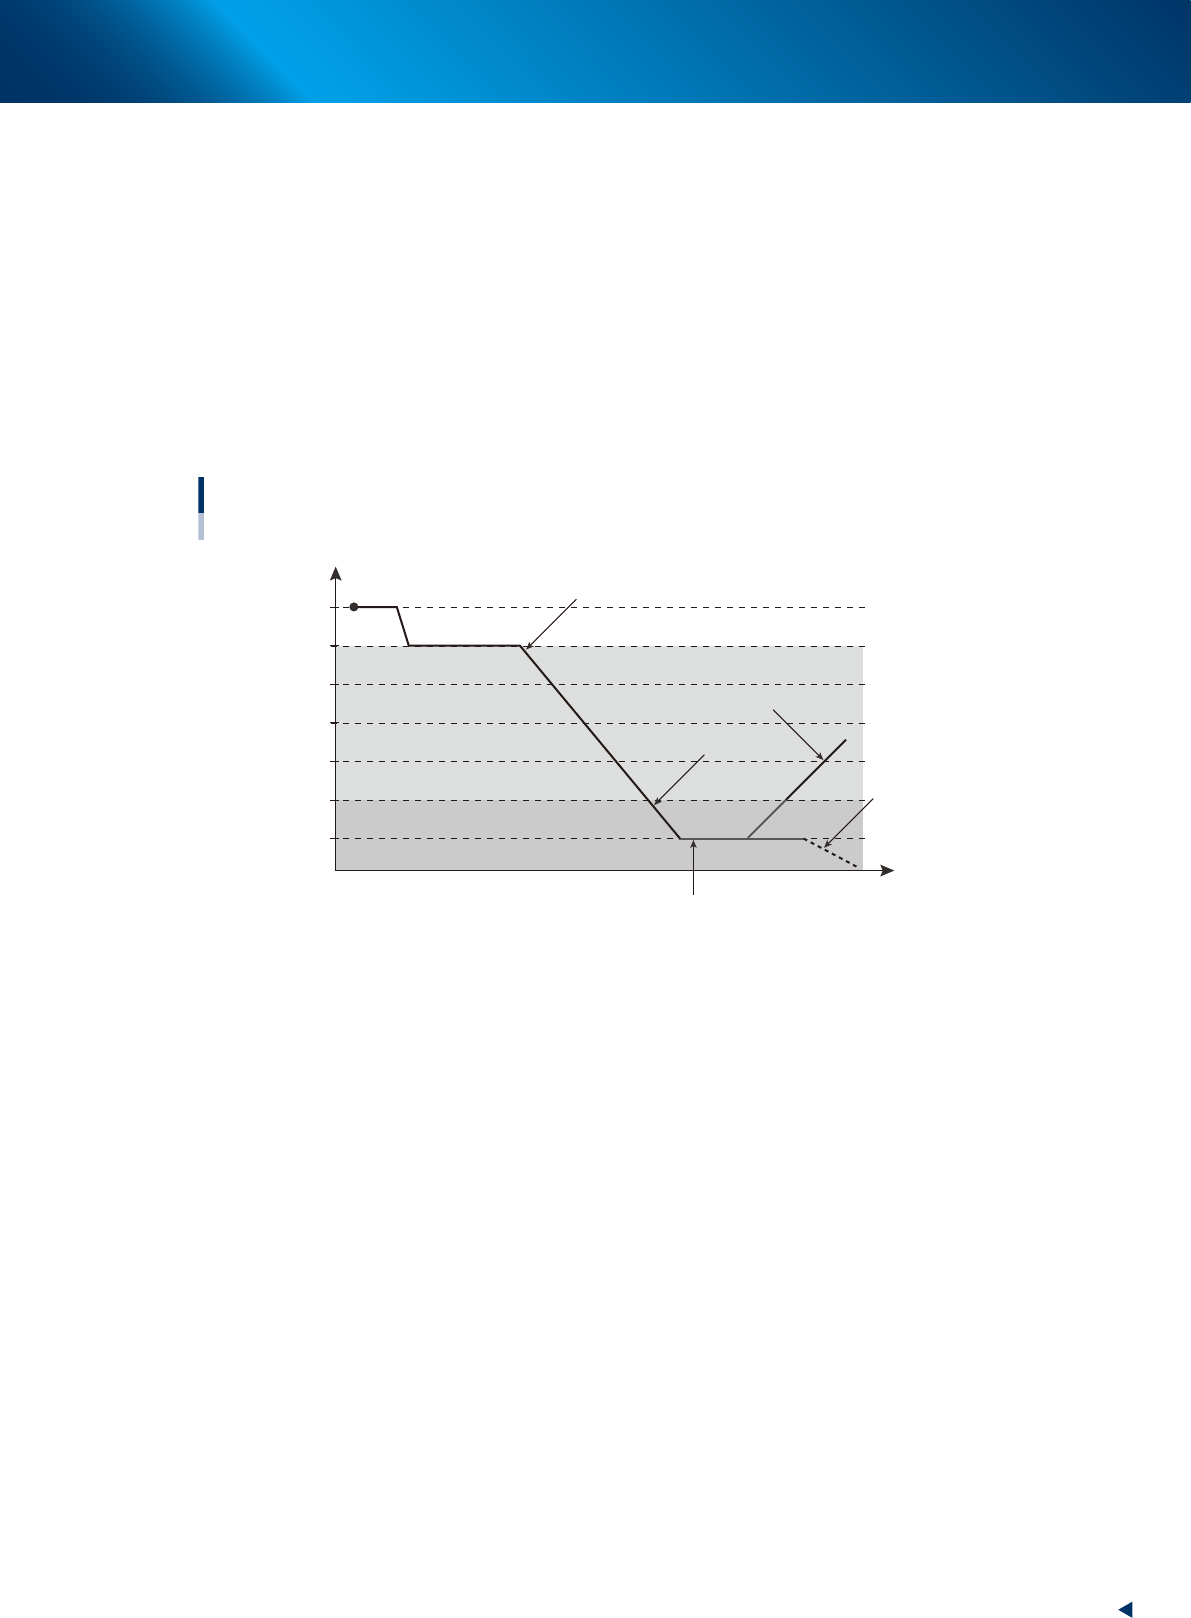
The colors in the following graph show changes in the pickup rate, using an example when "caution
(yellow)" is set to 99.00% and "warning (red)" to 95.00%.
100
99
98
97
96
95
94
Color transitions per changes in pickup rates
Pickup rate %
Time
Changes to yellowStart (white)
Changes to yellow (better pickup rate)
Changes to red
Changes to red
(worse pickup rate)
Pressing the [Current Check] or [All Check] button enables
"watch-and-wait" mode and changes the color of "red" row(s) to
"pink".
23201-KMX-00
3. Displaying the production monitors
2-42
Chapter 2 Basic operation
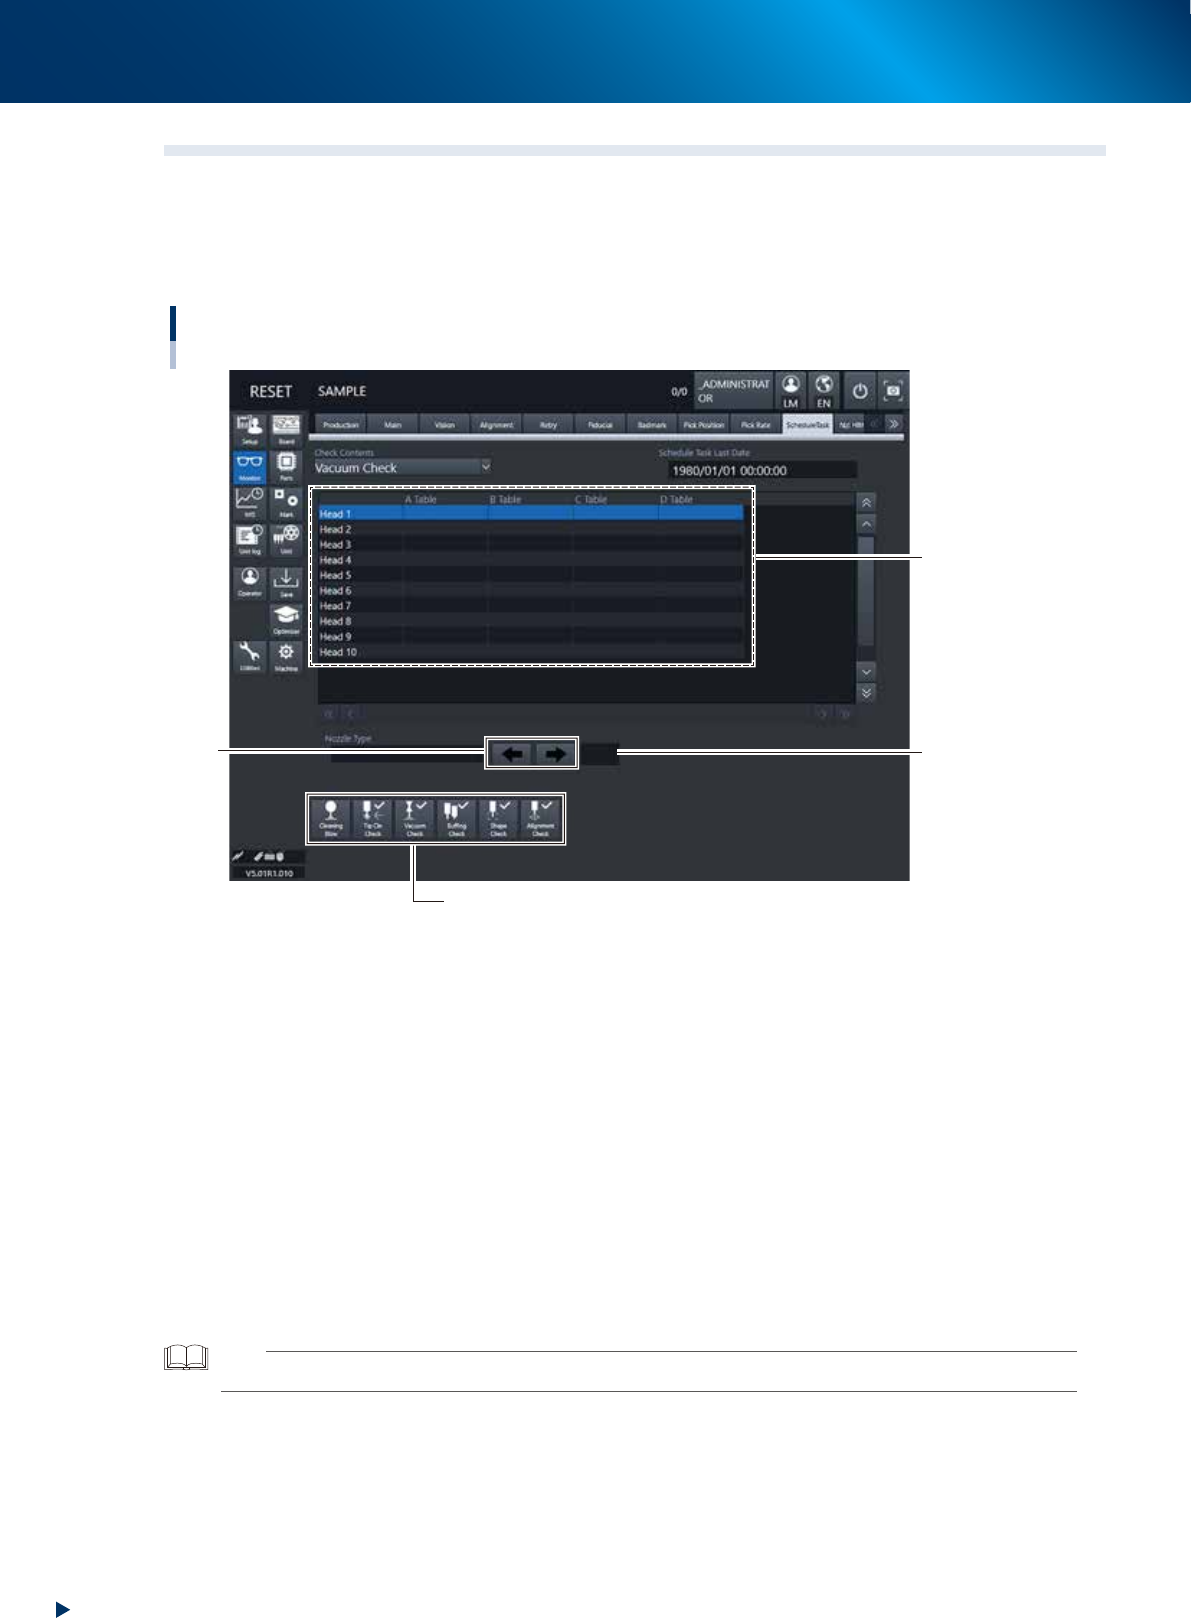
3.10 Schedule task
When executing the schedule tasks such as the “Vacuum Check” or the “Nozzle Tip Cleanliness Check”, this
screen shows the results.
The display contents are updated after each schedule task has been completed. Additionally, the error
information by head and information showing the execution results are recorded into the history.
Monitor: Schedule task
Execution
result list
Arrow
mark
Manual operation button
Page number
display
24222-KMX-00
• Check Contents
Change the schedule task type to be displayed from the full-down list.
Target : "Vacuum Check" "Nozzle Tip Dirt Check" "Nozzle Shaft Cleaning Blow" "Nozzle Shape
Check" "Nozzle Alignment Check"
• Schedule Task Last Date
Displays the last date and time when the schedule task was executed.
• Execution result list
Displays the schedule task execution result.
OK : Schedule task is completed successfully.
NG/Error : Schedule task is terminated abnormally.
Blank : Schedule task is not implemented.
TIP
The list shows tables (head units) A through D. However, this machine shows values in A Table and B only.