IPC-TM-650 EN 2022 试验方法--.pdf - 第16页
T a ble 1 Recommended evaluation criteria Metric Acceptable Marginal Inad equate IPC-TM-650 Page 2 of 6 Number 1.8 Subject Measurement Precision Estimation for Binary Data Date 01/03 Revision A test groups. Prepare more …
Accuracy –
Precision –
Binary Data –
Material in this Test Methods Manual was voluntarily established by Technical Committees of IPC. This material is advisory only
and its use or adaptation is entirely voluntary. IPC disclaims all liability of any kind as to the use, application, or adaptation of this
material. Users are also wholly responsible for protecting themselves against all claims or liabilities for patent infringement.
Equipment referenced is for the convenience of the user and does not imply endorsement by IPC.
Page 1 of 6
r
ASSOCIATION
CONNECTING
/
ELECTRONICS
INDUSTRIES
®
221
5
Sanders
Road
Northbrook,
IL
60062-6135
IPC-TM-650
TEST
METHODS
MANUAL
Number
1.8
Subject
Measurement
Precision
Estimation
for
Binary
Data
Date
01/03
Revision
A
Originating
Task
Group
Measurement
Precision
Task
Group
(7-1
1a)
1
Scope
Tests
performed
on
presumably
identical
samples
under
seemingly
identical
conditions
do
not
always
yield
iden¬
tical
results.
This
is
due
to
errors
inherent
in
every
measure¬
ment
or
evaluation.
During
the
development
of
a
new
test
procedure
or
use
of
an
existing
test
procedure,
this
variability
must
be
understood
and
precautions
taken
to
ensure
that
it
is
controlled
to
within
necessary
limits.
Performance
of
this
test
method
will
help
to
estimate
measurement
error
and
trouble¬
shoot
causes
of
measurement
variability.
Use
of
this
test
method
will
provide
some
evidence
that
a
new
test
procedure
is
suitable
for
use
when
submitted
for
review,
or
an
existing
test
procedure
is
capable
of
measuring
the
applicable
param¬
eter.
This
method
provides
a
standard
procedure
for
determining
the
precision
of
a
test
method
involving
binary
data
or
tests
that
result
in
two
outcomes.
These
include
evaluations
where
the
results
are
recorded
as
pass/fail
or
go/no-go.
Examples
include
solderability
tests
and
visual
inspections.
This
method
helps
to
estimate
how
often
the
disposition
is
performed
cor¬
rectly.
This
method
is
not
useful
for
measurements
which
result
in
variables
data,
or
where
more
than
three
repeated
measure¬
ments
or
more
than
ten
testers
are
used.
These
situations
are
covered
under
other
methods
(see
6.1).
1.1
Definitions
The
difference
between
an
observed
measure¬
ment
and
the
true
(but
perhaps
unknown)
value
being
mea¬
sured.
The
closeness
to
each
other
of
repeated
mea¬
surements
of
the
same
quantity.
Inspections
or
tests
in
which
parts
are
placed
in
one
of
two
classes.
This
includes
pass/fail,
go/no-go
tests
and
inspections.
2
Applicable
Documents
The
test
procedure
under
evalu¬
ation.
3
Test
Specimens
The
test
specimens
used
will
be
as
specified
in
the
test
procedure
under
investigation.
The
number
and
types
of
test
materials
to
be
used
will
depend
on
the
range
of
levels
in
the
class
of
materials
to
be
tested.
If
it
is
known
that
precision
is
worse
at
one
end
of
the
range,
evaluation
could
be
limited
to
that
end
of
the
range.
In
general,
evaluations
are
generally
advisable
for
all
combina¬
tions
of
materials,
levels,
set-ups,
and
conditions.
If
resources
are
limited,
begin
the
study
with
those
combinations
deemed
to
be
the
most
critical,
or
where
measurement
error
is
likely
to
be
greatest.
The
number
of
samples
will
also
depend
on
the
difficulty
involved
in
obtaining,
processing,
and
distributing
the
test
specimens,
the
difficulty,
length
of
time
required
for,
and
expense
of
performing
the
test,
and
other
prior
known
infor¬
mation.
This
test
method
will
assume
that
evaluations
can
be
repeated
on
the
same
samples.
For
situations
where
this
is
not
possible
or
the
sample
is
consumed
during
the
test,
other
methods
may
be
better
suited
(see
6.1).
4
Apparatus
The
apparatus
used
will
be
as
specified
by
the
test
procedure
under
investigation.
5
Procedure
5.1
Planning
Evaluation
Keep
the
evaluation
as
simple
as
possible
to
obtain
data
that
is
free
of
unintended
secondary
effects.
Prepare
a
procedure
that
is
complete
and
describes
the
test
parameters
as
well
as
recommended
techniques
for
assess¬
ing
the
outcome.
Include
known
best
practices
and
draw
extensively
on
the
experience
of
test
users.
The
method
used
in
this
procedure
allows
for
up
to
10
test
conditions.
Solicit
participants
from
among
the
community
of
facilities
with
the
proper
equipment,
competent
operators
and
familiarity
with
the
test.
In
order
to
obtain
representative
pre¬
cision
estimates,
do
not
select
only
from
a
small
group
of
users
who
are
considered
exceptionally
qualified.
Be
sure
to
specify
any
special
calibration
procedures
or
material
prepara¬
tion
requirements.
The
analysis
method
used
in
this
procedure
allows
for
up
to
10
repeated
evaluations
per
sample.
Carefully
evaluate
the
materials
to
determine
the
appropriate
classification
or
dispo¬
sition
before
the
study.
Choose
material
representing
a
likely
range
of
conditions
normally
encountered
during
routine
tests
or
inspections.
Randomize
the
samples
prior
to
dividing
into
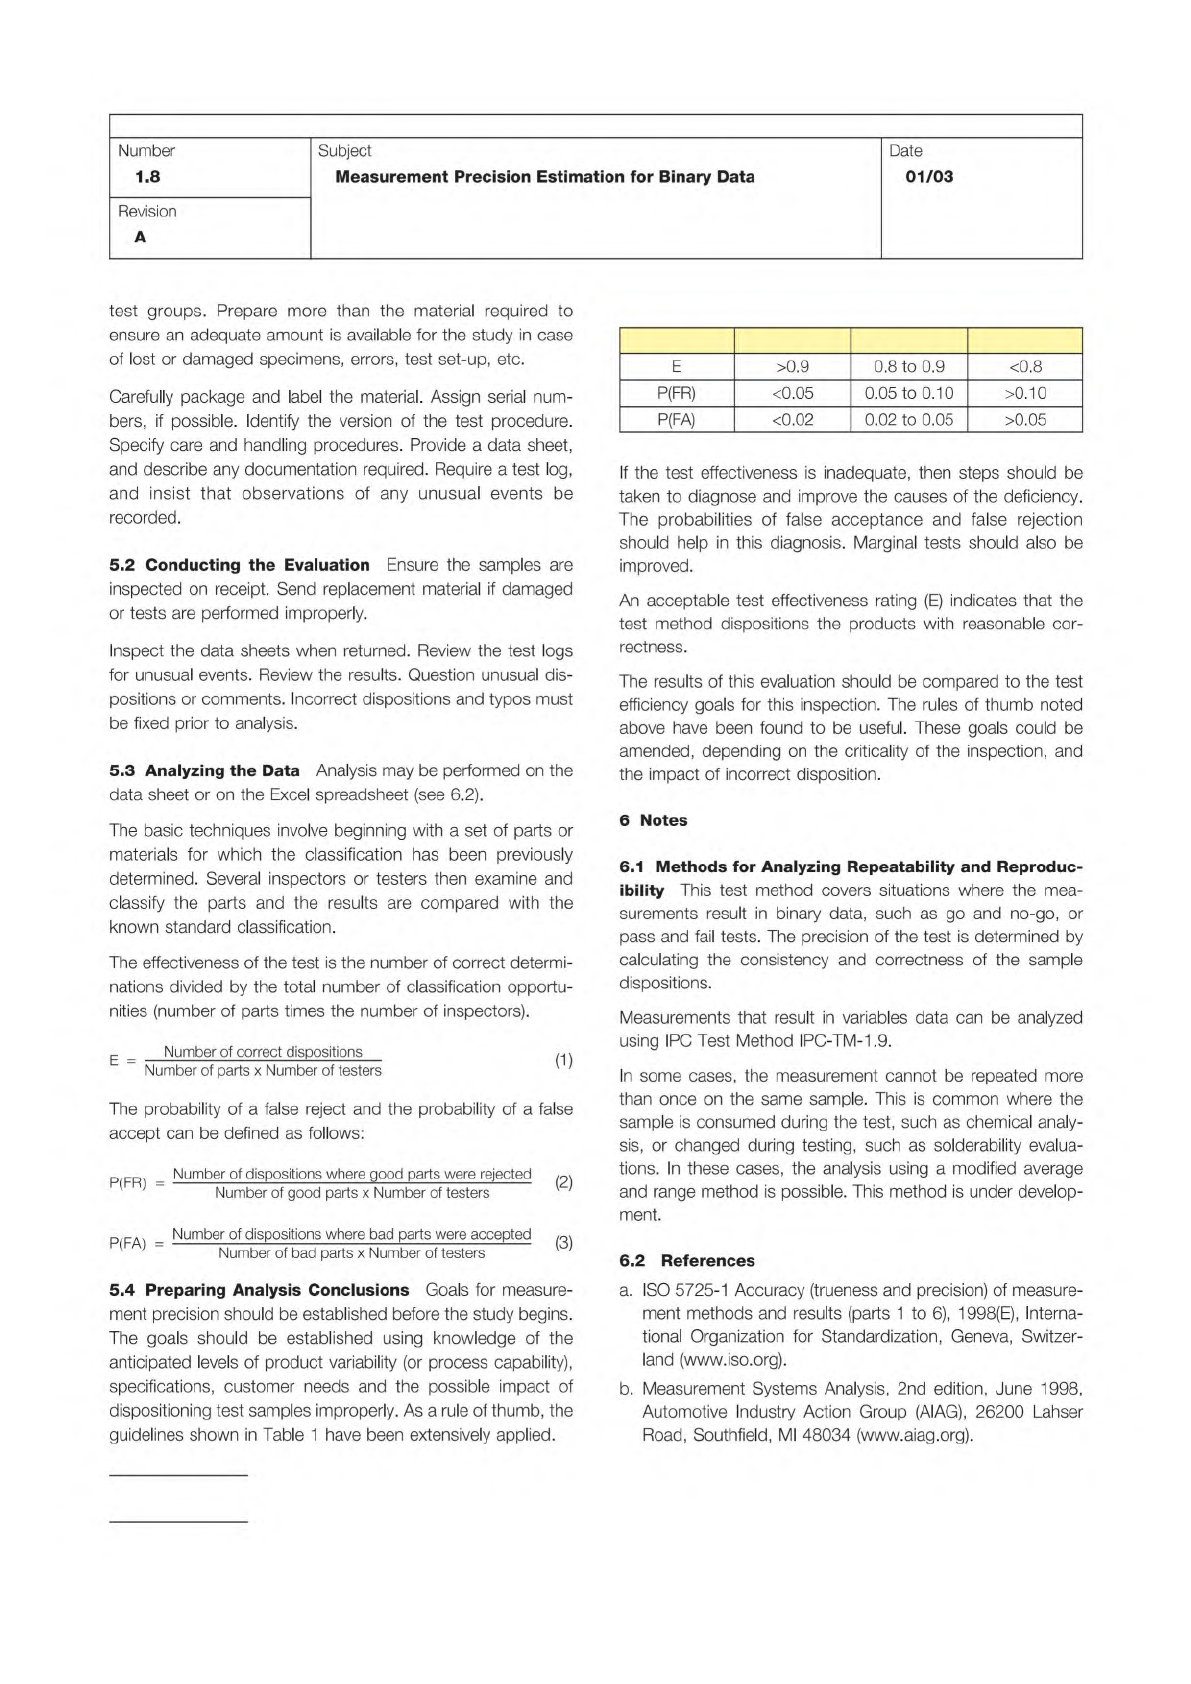
Table 1 Recommended evaluation criteria
Metric Acceptable Marginal Inadequate
IPC-TM-650
Page 2 of 6
Number
1.8
Subject
Measurement
Precision
Estimation
for
Binary
Data
Date
01/03
Revision
A
test
groups.
Prepare
more
than
the
material
required
to
ensure
an
adequate
amount
is
available
for
the
study
in
case
of
lost
or
damaged
specimens,
errors,
test
set-up,
etc.
Carefully
package
and
label
the
material.
Assign
serial
num¬
bers,
if
possible.
Identify
the
version
of
the
test
procedure.
Specify
care
and
handling
procedures.
Provide
a
data
sheet,
and
describe
any
documentation
required.
Require
a
test
log,
and
insist
that
observations
of
any
unusual
events
be
recorded.
5.2
Conducting
the
Evaluation
Ensure
the
samples
are
inspected
on
receipt.
Send
replacement
material
if
damaged
or
tests
are
performed
improperly.
Inspect
the
data
sheets
when
returned.
Review
the
test
logs
for
unusual
events.
Review
the
results.
Question
unusual
dis¬
positions
or
comments.
Incorrect
dispositions
and
typos
must
be
fixed
prior
to
analysis.
5.3
Analyzing
the
Data
Analysis
may
be
performed
on
the
data
sheet
or
on
the
Excel
spreadsheet
(see
6.2).
The
basic
techniques
involve
beginning
with
a
set
of
parts
or
materials
for
which
the
classification
has
been
previously
determined.
Several
inspectors
or
testers
then
examine
and
classify
the
parts
and
the
results
are
compared
with
the
known
standard
classification.
The
effectiveness
of
the
test
is
the
number
of
correct
determi¬
nations
divided
by
the
total
number
of
classification
opportu¬
nities
(number
of
parts
times
the
number
of
inspectors).
E
_
Number
of
correct
dispositions
~
Number
of
parts
x
Number
of
testers
'
'
The
probability
of
a
false
reject
and
the
probability
of
a
false
accept
can
be
defined
as
follows:
p
fr
_
Number
of
dispositions
where
good
parts
were
rejected
' '
-
Number
of
good
parts
x
Number
of
testers
'
'
p
,FA
_
Number
of
dispositions
where
bad
parts
were
accepted
(飞
' '
-
Number
of
bad
parts
x
Number
of
testers
'
'
5.4
Preparing
Analysis
Conclusions
Goals
for
measure¬
ment
precision
should
be
established
before
the
study
begins.
The
goals
should
be
established
using
knowledge
of
the
anticipated
levels
of
product
variability
(or
process
capability),
specifications,
customer
needs
and
the
possible
impact
of
dispositioning
test
samples
improperly.
As
a
rule
of
thumb,
the
guidelines
shown
in
Table
1
have
been
extensively
applied.
E
>0.9
0.8
to
0.9
<0.8
P(FR)
<0.05
0.05
to
0.10
>0.10
P(FA)
<0.02
0.02
to
0.05
>0.05
If
the
test
effectiveness
is
inadequate,
then
steps
should
be
taken
to
diagnose
and
improve
the
causes
of
the
deficiency.
The
probabilities
of
false
acceptance
and
false
rejection
should
help
in
this
diagnosis.
Marginal
tests
should
also
be
improved.
An
acceptable
test
effectiveness
rating
(E)
indicates
that
the
test
method
dispositions
the
products
with
reasonable
cor¬
rectness.
The
results
of
this
evaluation
should
be
compared
to
the
test
efficiency
goals
for
this
inspection.
The
rules
of
thumb
noted
above
have
been
found
to
be
useful.
These
goals
could
be
amended,
depending
on
the
criticality
of
the
inspection,
and
the
impact
of
incorrect
disposition.
6
Notes
6.1
Methods
for
Analyzing
Repeatability
and
Reproduc¬
ibility
This
test
method
covers
situations
where
the
mea¬
surements
result
in
binary
data,
such
as
go
and
no-go,
or
pass
and
fail
tests.
The
precision
of
the
test
is
determined
by
calculating
the
consistency
and
correctness
of
the
sample
dispositions.
Measurements
that
result
in
variables
data
can
be
analyzed
using
I
PC
Test
Method
IPC-TM-1
.9.
In
some
cases,
the
measurement
cannot
be
repeated
more
than
once
on
the
same
sample.
This
is
common
where
the
sample
is
consumed
during
the
test,
such
as
chemical
analy¬
sis,
or
changed
during
testing,
such
as
solderability
evalua¬
tions.
In
these
cases,
the
analysis
using
a
modified
average
and
range
method
is
possible.
This
method
is
under
develop¬
ment.
6.2
References
a.
ISO
5725-1
Accuracy
(trueness
and
precision)
of
measure¬
ment
methods
and
results
(parts
1
to
6),
1998(E),
Interna¬
tional
Organization
for
Standardization,
Geneva,
Switzer¬
land
(www.iso.org).
b.
Measurement
Systems
Analysis,
2nd
edition,
June
1998,
Automotive
Industry
Action
Group
(AIAG),
26200
Lahser
Road,
Southfield,
Ml
48034
(www.aiag.org).
IPC-TM-650
Page 3 of 6
Number
1.8
Subject
Measurement
Precision
Estimation
for
Binary
Data
Date
01/03
Revision
A
c.
Standard
Practice
for
Conducting
an
Interlaboratory
Study
to
Determine
the
Precision
of
a
Test
Method,
E691
-99,
ASTM,
Philadelphia,
PA
(www.astm.org).
d.
Concepts
for
R&R
Studies,
Larry
B.
Barrentine,
(ISBN
0-87389-108-2),
ASQC
Press,
Milwaukee,
Wl
((www.quali-
typress.asq.org).
e.
Basic
Statistics,
4th
Edition,
Mark
J.
Kiemele,
Stephen
R.
Schmidt,
Ronald
Berdine,
Air
Academy
Press,
1997,
ISBN
1-880156-06-7,
pages
9-71
to
9-77
f.
'Is
100%
Test
100%
Effective,”
W.
Russell,
1998
IPC
EXPO,
San
Jose,
CA
(gives
methods
for
calculating
the
likely
outcomes
on
product
test
for
differing
levels
of
mea¬
surement
precision.)
6.3
Software
Measurement
precision
studies
are
greatly
facilitated
by
use
of
software
to
perform
the
calculations.
Below
are
just
a
few
of
the
many
software
packages
which
can
be
used
for
this
purpose.
Reference
(a)
is
an
Excel
spreadsheet
written
to
perform
the
calculations
in
this
proce¬
dure.
a.
Measurement
Precision
Calculator
For
Binary
Data,
Excel
spreadsheet,
available
at
http://www.ipc.org/html/
testmethods.htm,
free
of
charge.
b.
Statgraphics
Plus,
Manugistics
Corp,
2115
East
Jefferson
Street,
Rockville,
MD,
20852-4999
(
ww
w
.
statg
rap
h
i
c
-
s.com).
c.
SPC
XL,
Air
Academy
Press,
1155
Kelly
Johnson
Blvd,
Colorado
Springs,
CO
80920
(www
.
ai
racad
.
oom)
.
d.
Minitab,
Minitab.
Inc.,
3081
Enterprise
Dr,
State
College,
PA
16801
(www.minitab.com).
e.
Interlaboratory
Data
Analysis
Software
for
E691
,
ASTM,
100
Barr
Harbor
Dr,
West
Conshohocken,
PA
19428
(www.astm.org).