IPC-TM-650 EN 2022 试验方法--.pdf - 第484页
Step 1 – Figure 5-13 Differ ential TDR Waveform -0.4 -0.3 -0.2 -0.1 0.0 0.1 0.2 0.3 0.4 Time Signal (V) Ch1 Ch2 T ransmission Line Measurement Zone t i t f IPC-TM-650 Page 16 of 23 Number 2.5.5.7 Subject Characteristic I…
Step 3 –
Step 4 –
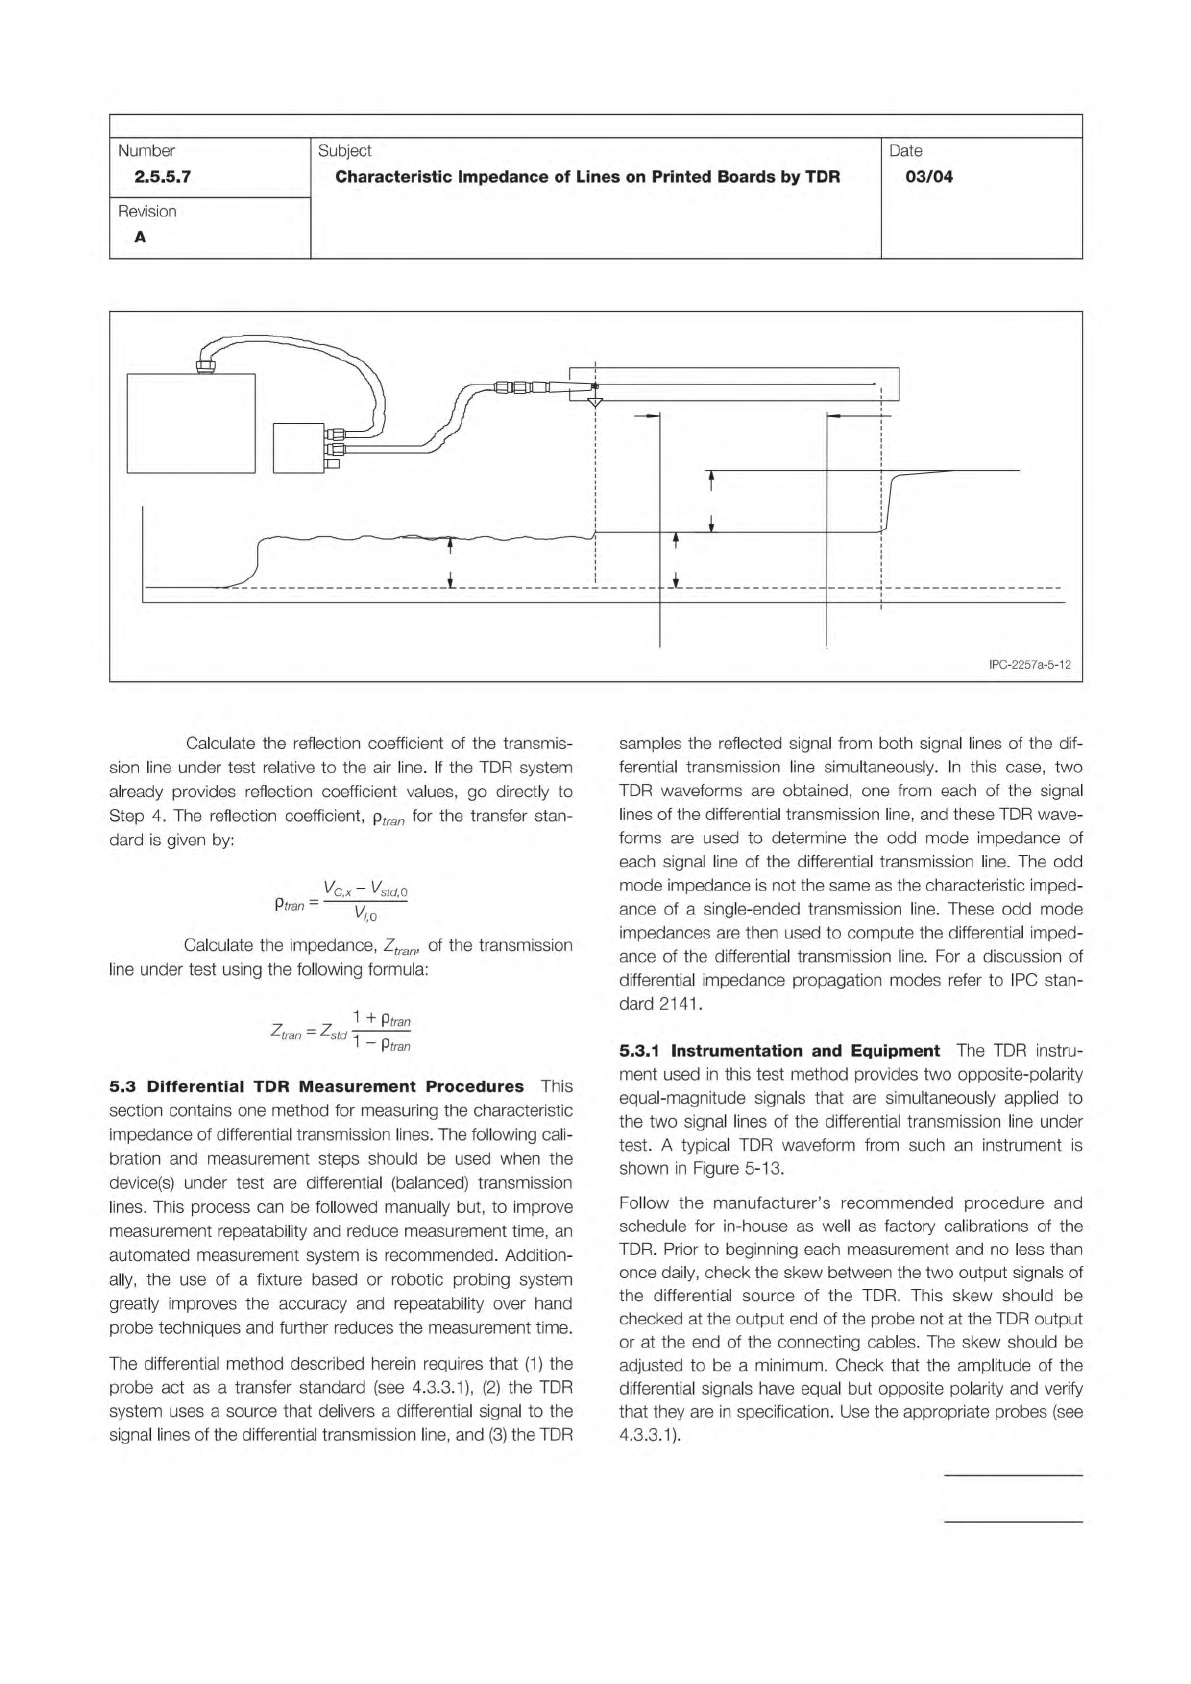
Figure 5-12 TDR Measurement of Transmission Line
PROBE
SPD
TDR
INSTRUMENT
V
C,ave
PRECISION
RF CABLE
V
check
TRANSMISSION LINE UNDER TEST
MEASUREMENT ZONE
for TRANSMISSION
LINE UNDER TEST
t
f,TL
t
i,TL
TIME
V
r,1
IPC-TM-650
Page 15 of 23
Number
2.5.5.7
Subject
Characteristic
Impedance
of
Lines
on
Printed
Boards
by
TDR
Date
03/04
Revision
A
Calculate
the
reflection
coefficient
of
the
transmis¬
sion
line
under
test
relative
to
the
air
line.
If
the
TDR
system
already
provides
reflection
coefficient
values,
go
directly
to
Step
4.
The
reflection
coefficient,
^tran
for
the
transfer
stan¬
dard
is
given
by:
Ptran
二
[/
%;0
Calculate
the
impedance,
Ztran,
of
the
transmission
line
under
test
using
the
following
formula:
1
+
Ptran
/■tran
=
^std
~
।
-
Ptran
5.3
Differential
TDR
Measurement
Procedures
This
section
contains
one
method
for
measuring
the
characteristic
impedance
of
differential
transmission
lines.
The
following
cali¬
bration
and
measurement
steps
should
be
used
when
the
device(s)
under
test
are
differential
(balanced)
transmission
lines.
This
process
can
be
followed
manually
but,
to
improve
measurement
repeatability
and
reduce
measurement
time,
an
automated
measurement
system
is
recommended.
Addition¬
ally,
the
use
of
a
fixture
based
or
robotic
probing
system
greatly
improves
the
accuracy
and
repeatability
over
hand
probe
techniques
and
further
reduces
the
measurement
time.
The
differential
method
described
herein
requires
that
(1)
the
probe
act
as
a
transfer
standard
(see
4.
3.
3.1),
(2)
the
TDR
system
uses
a
source
that
delivers
a
differential
signal
to
the
signal
lines
of
the
differential
transmission
line,
and
(3)
the
TDR
samples
the
reflected
signal
from
both
signal
lines
of
the
dif¬
ferential
transmission
line
simultaneously.
In
this
case,
two
TDR
waveforms
are
obtained,
one
from
each
of
the
signal
lines
of
the
differential
transmission
line,
and
these
TDR
wave¬
forms
are
used
to
determine
the
odd
mode
impedance
of
each
signal
line
of
the
differential
transmission
line.
The
odd
mode
impedance
is
not
the
same
as
the
characteristic
imped¬
ance
of
a
single-ended
transmission
line.
These
odd
mode
impedances
are
then
used
to
compute
the
differential
imped¬
ance
of
the
differential
transmission
line.
For
a
discussion
of
differential
impedance
propagation
modes
refer
to
I
PC
stan¬
dard
2141.
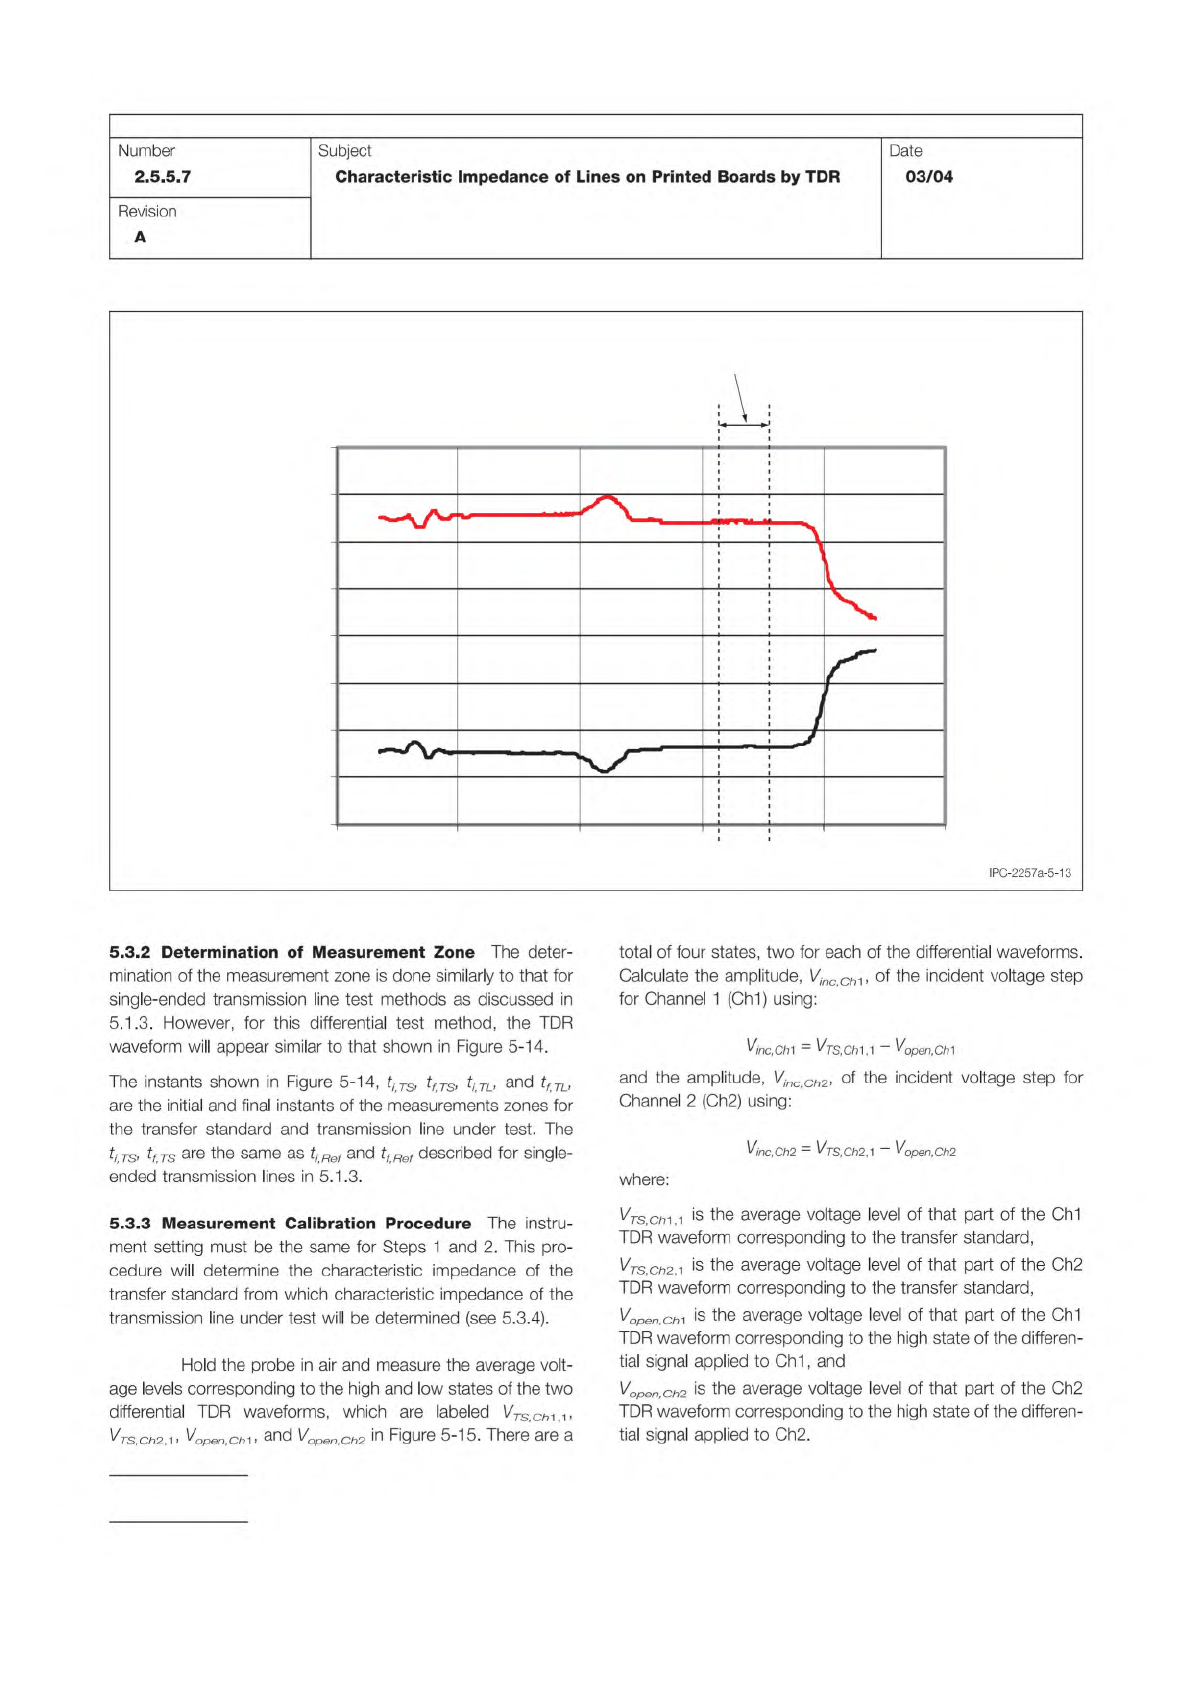
5.3.1
Instrumentation
and
Equipment
The
TDR
instru¬
ment
used
in
this
test
method
provides
two
opposite-polarity
equal-magnitude
signals
that
are
simultaneously
applied
to
the
two
signal
lines
of
the
differential
transmission
line
under
test.
A
typical
TDR
waveform
from
such
an
instrument
is
shown
in
Figure
5-13.
Follow
the
manufacturer's
recommended
procedure
and
schedule
for
in-house
as
well
as
factory
calibrations
of
the
TDR.
Prior
to
beginning
each
measurement
and
no
less
than
once
daily,
check
the
skew
between
the
two
output
signals
of
the
differential
source
of
the
TDR.
This
skew
should
be
checked
at
the
output
end
of
the
probe
not
at
the
TDR
output
or
at
the
end
of
the
connecting
cables.
The
skew
should
be
adjusted
to
be
a
minimum.
Check
that
the
amplitude
of
the
differential
signals
have
equal
but
opposite
polarity
and
verify
that
they
are
in
specification.
Use
the
appropriate
probes
(see
4.3.3.1).
Step 1 –
Figure 5-13 Differential TDR Waveform
-0.4
-0.3
-0.2
-0.1
0.0
0.1
0.2
0.3
0.4
Time
Signal (V)
Ch1
Ch2
Transmission Line
Measurement Zone
t
i
t
f
IPC-TM-650
Page 16 of 23
Number
2.5.5.7
Subject
Characteristic
Impedance
of
Lines
on
Printed
Boards
by
TDR
Date
03/04
Revision
A
5.3.2
Determination
of
Measurement
Zone
The
deter¬
mination
of
the
measurement
zone
is
done
similarly
to
that
for
single-ended
transmission
line
test
methods
as
discussed
in
5.1
.3.
However,
for
this
differential
test
method,
the
TDR
waveform
will
appear
similar
to
that
shown
in
Figure
5-14.
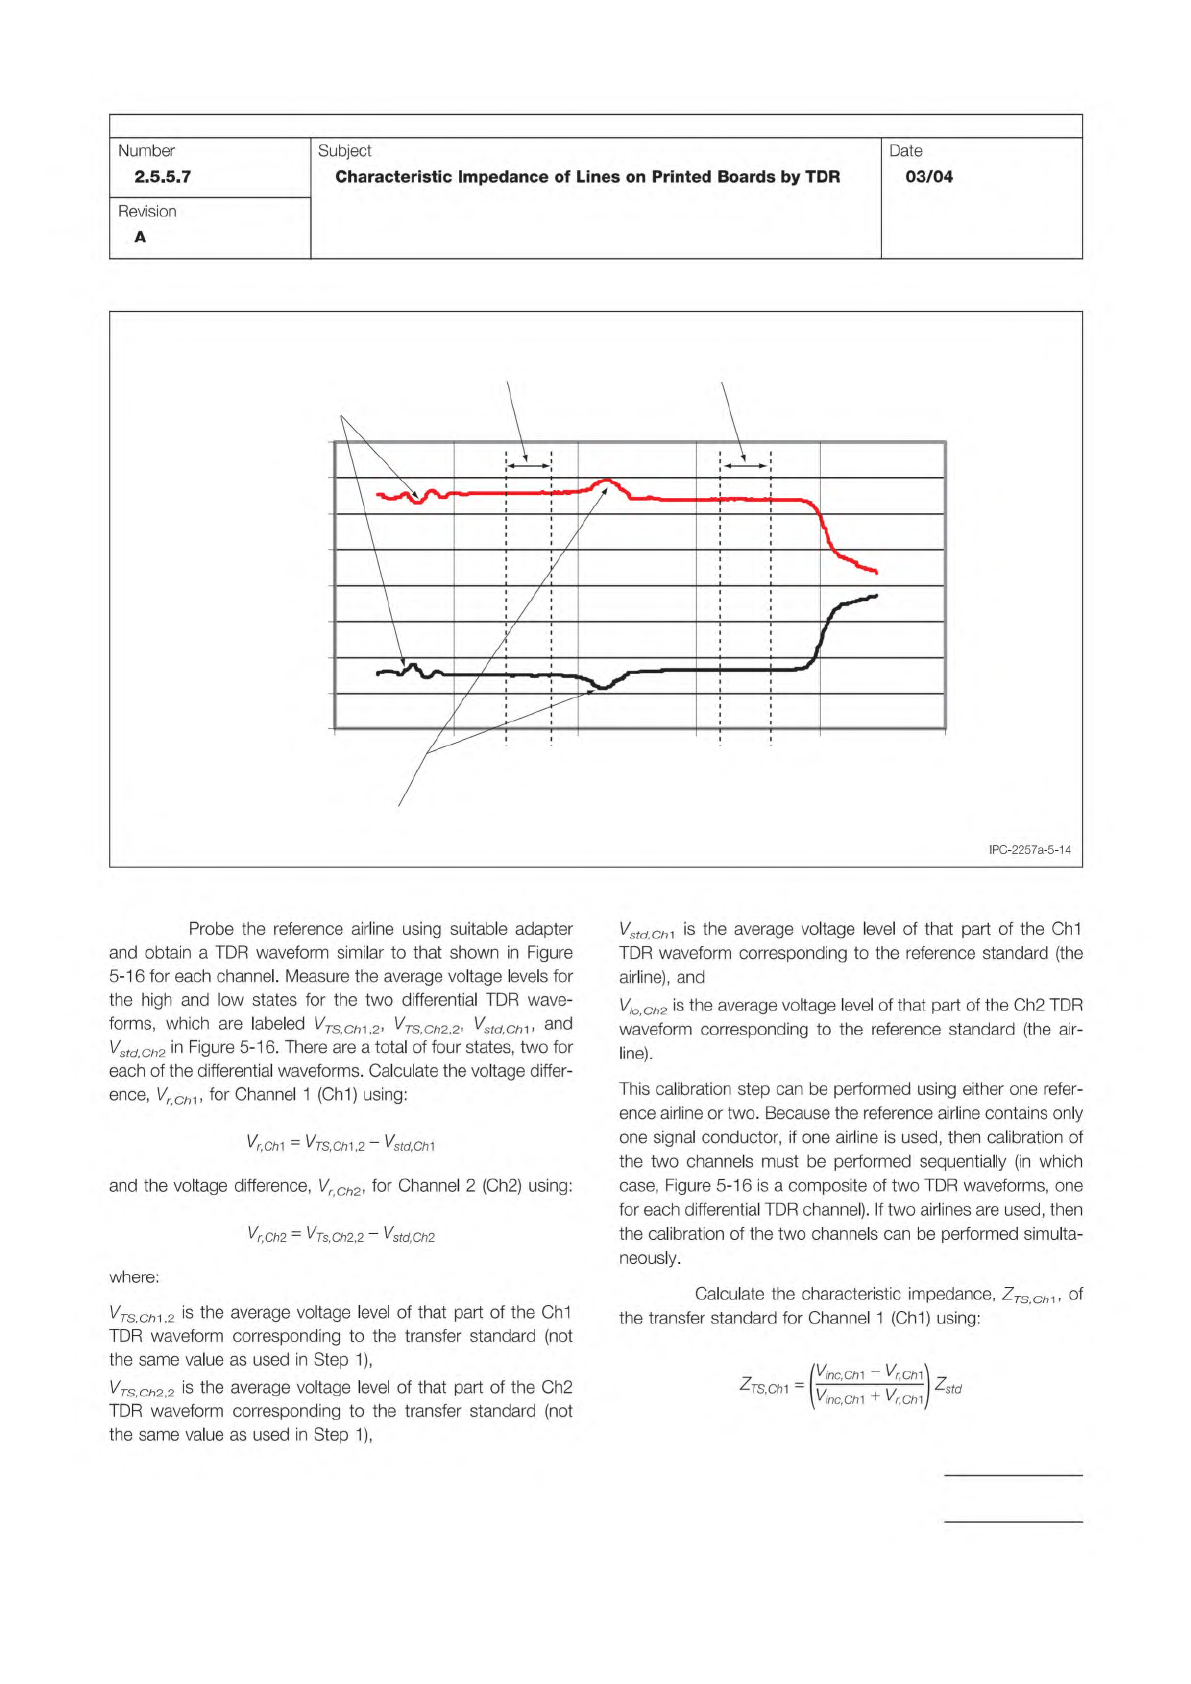
The
instants
shown
in
Figure
5-14,
ti
TS)
tfTS)
tiTL,
and
tf
TL,
are
the
initial
and
final
instants
of
the
measurements
zones
for
the
transfer
standard
and
transmission
line
under
test.
The
ti
TSf
tf
TS
are
the
same
as
and
tf
Ref
described
for
single-
ended
transmission
lines
in
5.1.3.
5.3.3
Measurement
Calibration
Procedure
The
instru¬
ment
setting
must
be
the
same
for
Steps
1
and
2.
This
pro¬
cedure
will
determine
the
characteristic
impedance
of
the
transfer
standard
from
which
characteristic
impedance
of
the
transmission
line
under
test
will
be
determined
(see
5.3.4).
Hold
the
probe
in
air
and
measure
the
average
volt¬
age
levels
corresponding
to
the
high
and
low
states
of
the
two
differential
TDR
waveforms,
which
are
labeled
\ZTs,ch-\^>
^Ts,ch2,-i>
^open.ch^
Vopen
Ch2
in
Figure
5-15.
There
are
a
total
of
four
states,
two
for
each
of
the
differential
waveforms.
Calculate
the
amplitude,
Vjnc
ChA,
of
the
incident
voltage
step
for
Channel
1
(Ch1)
using:
Vine,
Chi
=
-
Vopen,Ch1
and
the
amplitude,
Vinc
Ch2,
of
the
incident
voltage
step
for
Channel
2
(Ch2)
using:
Vinc,Ch2
=
^TS,Ch2,-\
-
^open,Ch2
where:
Vtssli
is
the
average
voltage
level
of
that
part
of
the
Ch1
TDR
waveform
corresponding
to
the
transfer
standard,
VTS
Ch2
^
is
the
average
voltage
level
of
that
part
of
the
Ch2
TDR
waveform
corresponding
to
the
transfer
standard,
V
open,
chi
is
the
average
voltage
level
of
that
part
of
the
Ch1
TDR
waveform
corresponding
to
the
high
state
of
the
differen¬
tial
signal
applied
to
Ch1
,
and
Vopen,ch2
is
the
average
voltage
level
of
that
part
of
the
Ch2
TDR
waveform
corresponding
to
the
high
state
of
the
differen¬
tial
signal
applied
to
Ch2.
Step 2 –
Step 3 –
Figure 5-14 Measurement Zones for Differential TDR
-0.4
-0.3
-0.2
-0.1
0.0
0.1
0.2
0.3
0.4
Time
Signal (V)
Ch1
Ch2
TDR/Probe Interface
Probe/Transmission Line Interface
Transfer Standard
Measurement Zone
T
ransmission Line
Measurement Zone
t
i,TS
t
i,TL
t
f,TL
t
f,TS
IPC-TM-650
Page 17 of 23
Number
2.5.5.7
Subject
Characteristic
Impedance
of
Lines
on
Printed
Boards
by
TDR
Date
03/04
Revision
A
IPC-2257a-5-14
Probe
the
reference
airline
using
suitable
adapter
and
obtain
a
TDR
waveform
similar
to
that
shown
in
Figure
5-16
for
each
channel.
Measure
the
average
voltage
levels
for
the
high
and
low
states
for
the
two
differential
TDR
wave¬
forms,
which
are
labeled
VTSChV2,
VTSiCh2
2,
%内,61,
and
Vstd
Ch2
in
Figure
5-1
6.
There
are
a
total
of
four
states,
two
for
each
of
the
differential
waveforms.
Calculate
the
voltage
differ¬
ence,
“61,
for
Channel
1
(Ch1)
using:
%,C/71
-
^TS,CtT\,2
-
Vstd,Ch1
and
the
voltage
difference,
VrCh2,
for
Channel
2
(Ch2)
using:
^r,Ch2
=
^Ts,Ch2,2
-
^std,Ch2
where:
VTs,chA,2
is
the
average
voltage
level
of
that
part
of
the
Ch1
TDR
waveform
corresponding
to
the
transfer
standard
(not
the
same
value
as
used
in
Step
1),
VTSiCh2
2
is
the
average
voltage
level
of
that
part
of
the
Ch2
TDR
waveform
corresponding
to
the
transfer
standard
(not
the
same
value
as
used
in
Step
1),
VstdChA
is
the
average
voltage
level
of
that
part
of
the
Ch1
TDR
waveform
corresponding
to
the
reference
standard
(the
airline),
and
V/o
Ch2
is
the
average
voltage
level
of
that
part
of
the
Ch2
TDR
waveform
corresponding
to
the
reference
standard
(the
air¬
line).
This
calibration
step
can
be
performed
using
either
one
refer¬
ence
airline
or
two.
Because
the
reference
airline
contains
only
one
signal
conductor,
if
one
airline
is
used,
then
calibration
of
the
two
channels
must
be
performed
sequentially
(in
which
case,
Figure
5-16
is
a
composite
of
two
TDR
waveforms,
one
for
each
differential
TDR
channel).
If
two
airlines
are
used,
then
the
calibration
of
the
two
channels
can
be
performed
simulta¬
neously.
Calculate
the
characteristic
impedance,
ZTSCh-^y
of
the
transfer
standard
for
Channel
1
(Ch1)
using:
7
(Vjnc,Ch1
-
^r.ChA
T
々
s,
cm
二
7^7
^std
yinc.Chl
+
vr,Ch1
j