IPC-TM-650 EN 2022 试验方法--.pdf - 第543页
5. 5 FD P ro ce du re T hi s s pe ci fi ca ti o n cu r ren tl y ou t li nes measurin g Fr equen cy D omain ch aracteri stics usi ng a VNA (Vector Netw ork Analyzer). O ptionally, a TDT ( Time Domain Tra nsmis sion ) syst…
IPC-25512-5-17
G
+
G
q1
q2
G
+
G
G
+
G
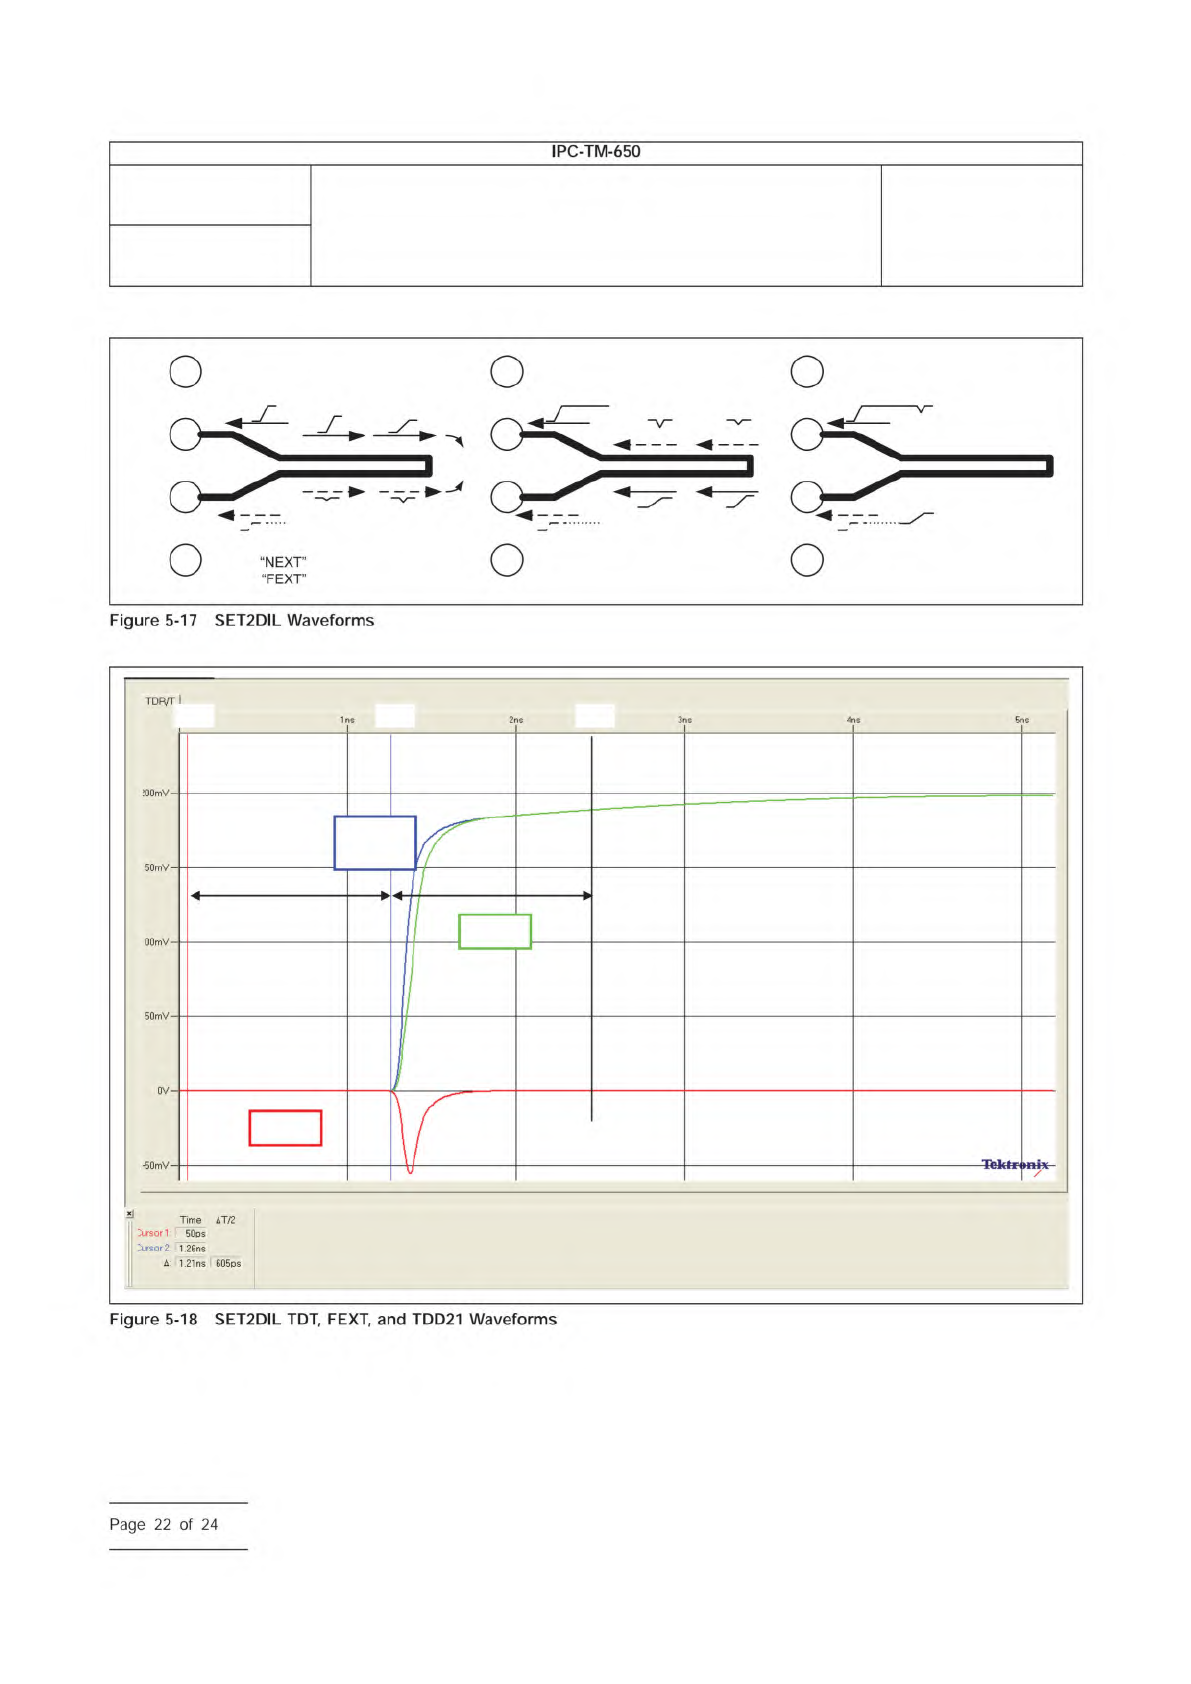
TDR
TDT
NEXT
FEXT
TDT
FEXT
FEXT
FEXT
TDT
TDT
NEXT
TDR
NEXT + TDT
TDR + FEXT
Note:
= Near End Cross Talk
= Far End Cross Talk
q1 final
q2 final
SET2DIL
TDD21
Td Td
t0 t1 t2
Number
2.5.5.12
Subject
Test Methods to Determine the Amount of Signal Loss on
Printed Boards
Date
07/12
Revision
A
IPC-TM-650
—
Page
22
of
24
5.5 FD Procedure
This specification currently outlines
measuring Frequency Domain characteristics using a VNA
(Vector Network Analyzer). Optionally, a TDT (Time Domain
Transmission) system may instead be used to create the
frequency domain loss data. The TDT essentially compares
the FFT (Fast Fourier Transform) of a calibration ‘‘through’’ to
the FTT of the test sample. The output is the S21 scattering
parameter matrix.
5.5.1 VNA Settings
Recommended settings for the VNA
include an IF bandwidth of 1 kHz and a step size of 10 MHz.
5.5.2 VNA Calibration
A short, open, load, and through
(SOLT) calibration must be preformed to obtain accurate VNA
measurement. This calibration
be done at the tip of the
probing solution; therefore, the calibration structure will
depend on the probing solution used.
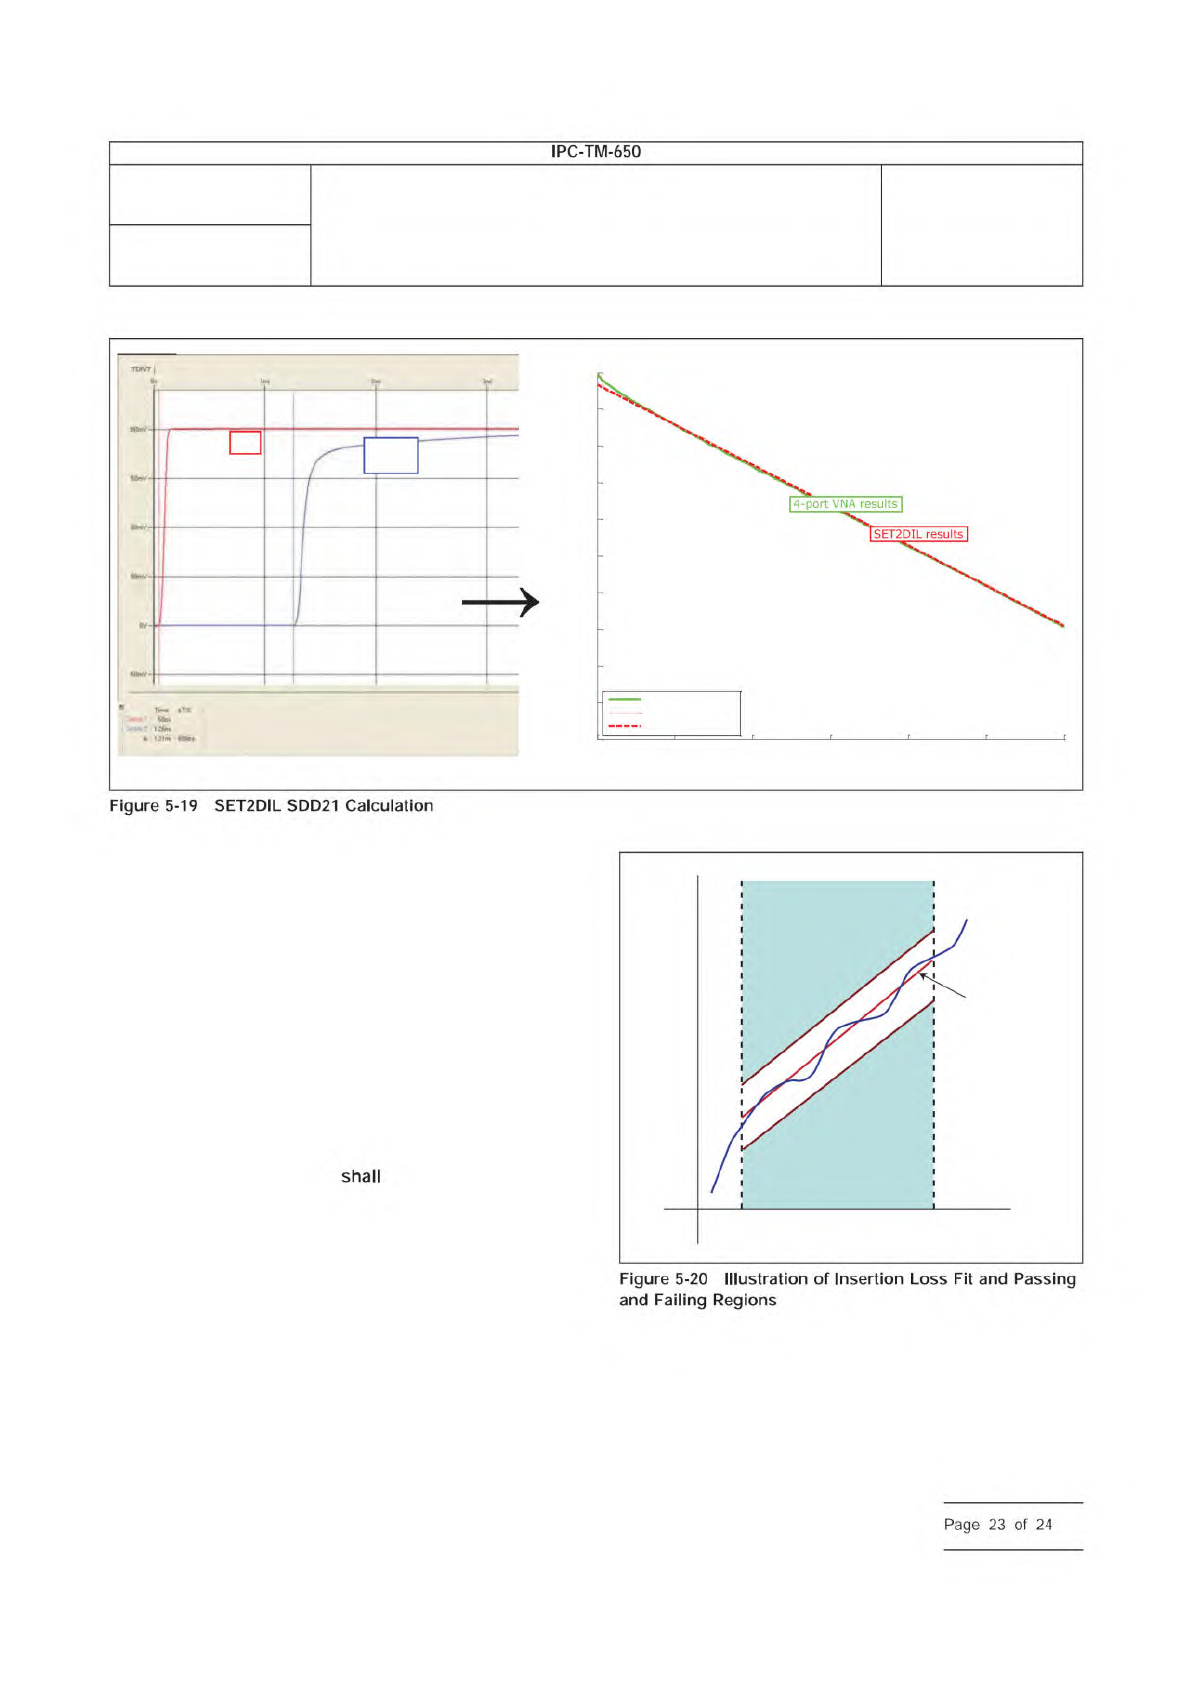
5.5.3 FD Measurement Adherence
The metric used to
determine material ‘‘goodness’’ is insertion loss. Insertion loss
(IL) is defined as the negative of S21 expressed in decibels.
The through scattering parameter, S21, is a direct output from
the VNA or a TDT instrument. The insertion loss fit is used to
determine passing and failing lines. The slope the Insertion
loss fit, ma, can be used as another metric. Figure 5-20 illus-
trates the insertion loss of a line, the respective fit, and limit
regions.
The slope, m
a
, is representative of the average IL obtained
from the test sample. This slope should be less than the
slope, m
spec
, of the pass/fail line that is material dependent.
thru
SET2DIL
TDD21
0 2 4 6 8 10 12
x 10
9
-20
-18
-16
-14
-12
-10
-8
-6
-4
-2
0
VNA vs. SET2DIL (raw and fitted), L1, 100 ohms
Frequency (Hz)
SDD21 Magnitude (dB)
VNA 370HR
SET2DILraw 370HR
SET2DILfit 370HR
IPC-25512-5-20
Failing region high
Insertion
Loss
Fit Line
Failing region low
Frequencyf1
dB
f2
Number
2.5.5.12
Subject
Test Methods to Determine the Amount of Signal Loss on
Printed Boards
Date
07/12
Revision
A
IPC-TM-650
—
Figure
5-19
SET2DIL
SDD21
Calculation
Page
23
of
24

5.5.4 Calculating Average Insertion Loss Slope m
a
and
Intercept b
a
For ‘‘N’’ points between frequency range f1 to
f2 the average insertion loss slope and intercept are defined
as follows in Equations 5-15 to 5-18.
,
avg
=
1
N
Σ
n
,
n
[5-15]
IL
avg
=
1
N
Σ
n
IL(,
n
)
[5-16]
m
A
=
1
N
Σ
n
(,
n
− ,
avg
) ⋅ (IL(,
n
) − IL
avg
)
Σ
(,
n
− ,
avg
)
2
[5-17]
b
A
= IL
avg
− m
A
⋅ ,
avg
[5-18]
Suggested values of f1 and f2 are 1 GHz and 5 GHz respec-
tively.
The slope m
a
is a measure of the total frequency dependent
attenuation, α, which is described in IPC-2141.
Number
2.5.5.12
Subject
Test Methods to Determine the Amount of Signal Loss on
Printed Boards
Date
07/12
Revision
A
IPC-TM-650
Page
24
of
24