IPC-TM-650 EN 2022 试验方法--.pdf - 第564页
IPC-TM-650 Number S ubject Date Revision 5.2.7 Calculation It is recommended to use the computer software provided by the equipment supplier for this calculation. If software not available, the Relative Permittivity and …
IPC-TM-650
Number Subject Date
Revision
4.5 Micrometer
A micrometer with a minimal resolution of 0.001mm [0.00004 inch] or better.
4.6 Circulating Oven
An air circulating oven with capable of a temperature of 105 ± 1 °C [221 ± 1.8 °F].
4.7 Test Chamber
A test chamber for variable temperature testing capable of a range of -125 °C to +110 °C [-193 to +230 °F]. Other
temperature ranges may be used as agreed between user and supplier. Temperature accuracy must be ± 1 °C ( ± 1.8 °F) of actual set
point.
5 Procedure
5.1 Preconditioning
All specimens shall be conditioned at 23 ± 2 °C [73.4 ± 3.6 °C] and 50 ± 5 % RH for a minimum of 24 hour after
etching and prior to testing.
5.2 Testing of relative permittivity and loss tangent at room temperature
5.2.1
The ambient test temperature should be 23 °C ± 2 °C [73.4 ± 3.6 °F]. The variation should not exceed ± 1 °C [± 1.8 °F] during
the test. Allow a minimum of 30 minutes for the VNA to warm up and stabilize.
5.2.2
Select a SPDR test fixture in accordance with the test frequency. The specimen size and thickness shall comply with the
requirements specified in Table 1. For example, if the test frequency is 10 GHz, a SPDR test fixture with 10 GHz nominal frequency
should be selected. The supported specimen size is 80 mm × 80 mm [3.2 X 3.2 inch] and the maximum thickness of specimens is no
more than 0.9 mm [0.035 inch].
5.2.3
Connect the SPDR test fixture to VNA. The test fixture shall be kept horizontal. Set the VNA parameters according to the
manufacturer’s instructions and the nominal frequency of the SPDR fixture.
5.2.4
Measure resonance frequency (f
0
) and Q-factor (Q
0
) values of the empty resonator.
5.2.5
Utilize a micrometer to measure the thickness of the specimen and record as h. Insert the specimen into the test fixture. The side
with marking is face up and the edge of this side has to be aligned with the fixture edge.
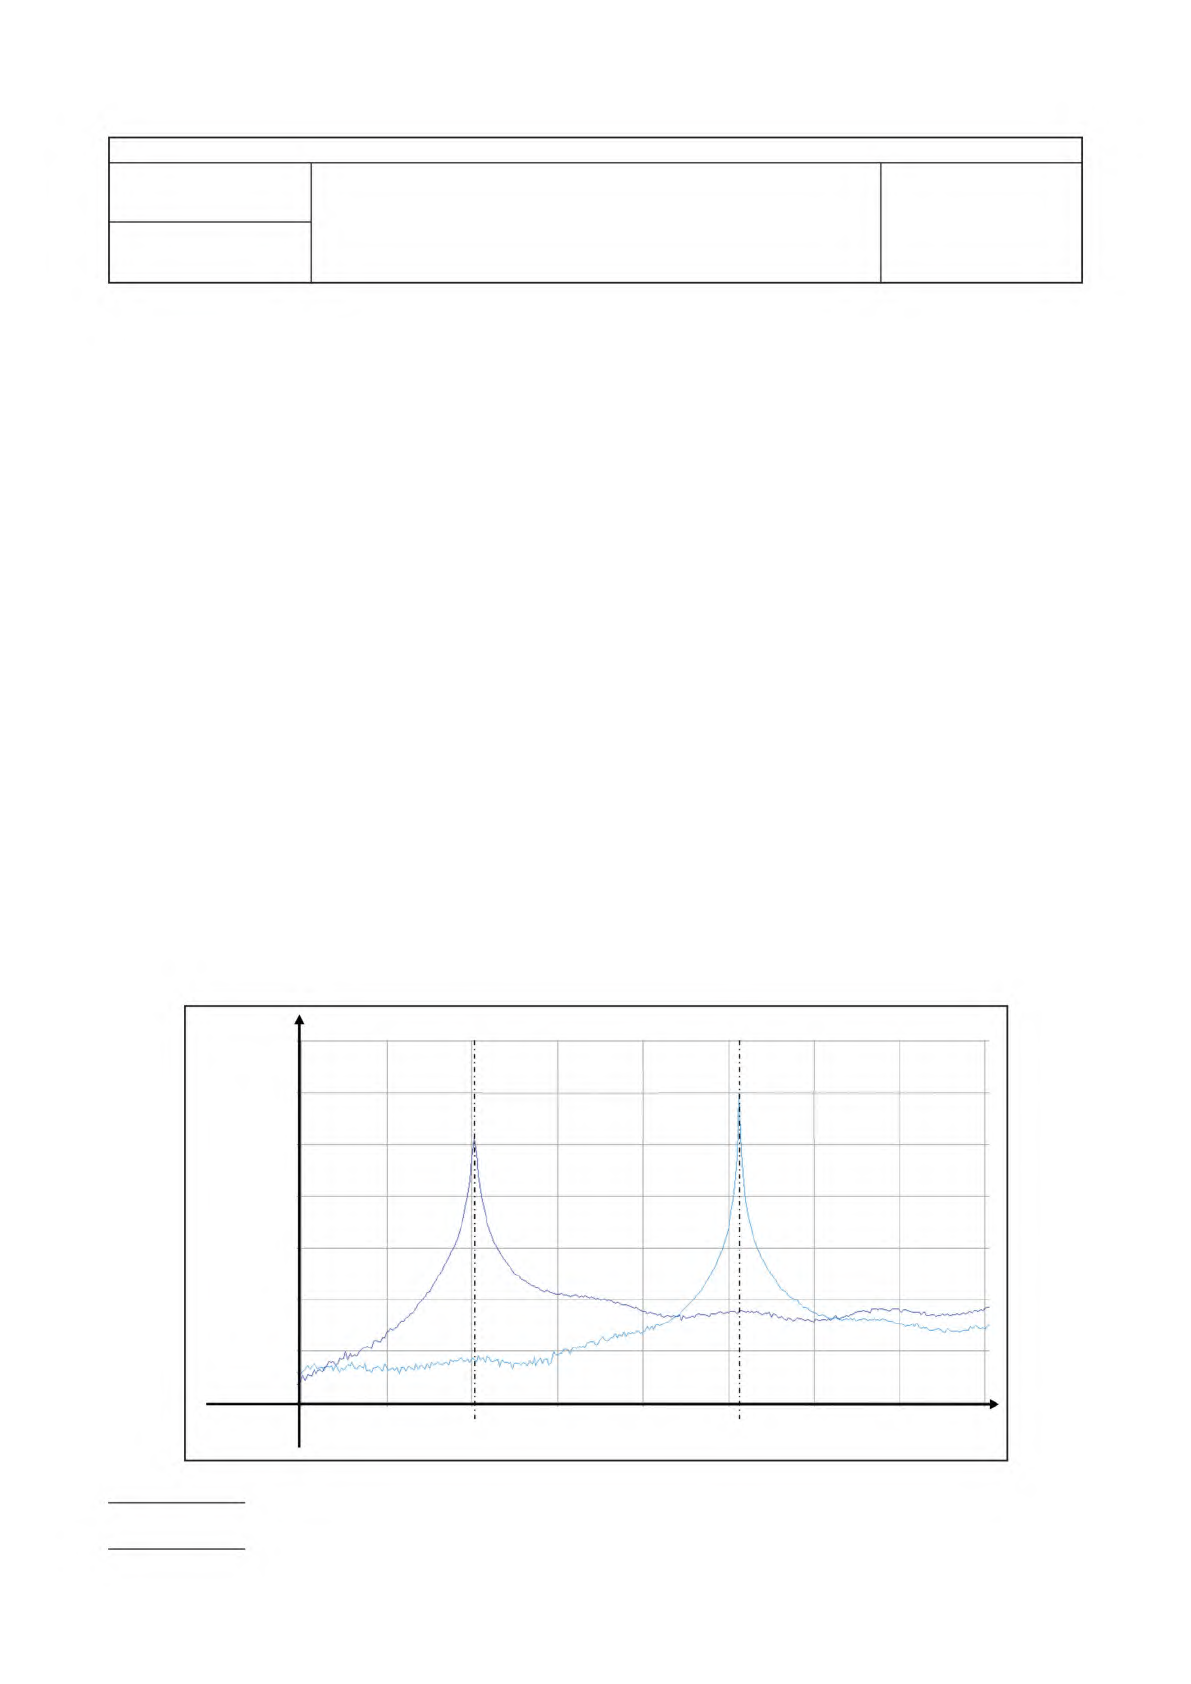
5.2.6
Measure the resonance frequency (f
s
) and Q-factor (Q
s
) of the resonator containing the specimen. A plot of the change of
resonance frequency with or without the specimen is shown in Figure 3.
Resonance
amplitude
f
r
f
Resonance
frequency
0
Empty resonator
Resonator
containing the
specimen
Figure3–PlotShowingChangeofResonanceFrequency
2.5.5.15
RelativePermittivityandLossTangentUsinga
06/22
Split-PostDielectricResonator
N/A
Page 4 of 7
―
IPC-TM-650
Number Subject Date
Revision
5.2.7 Calculation
It is recommended to use the computer software provided by the equipment supplier for this calculation. If software not
available, the Relative Permittivity and Loss Tangent at room temperature shall be calculated using the formula shown below.
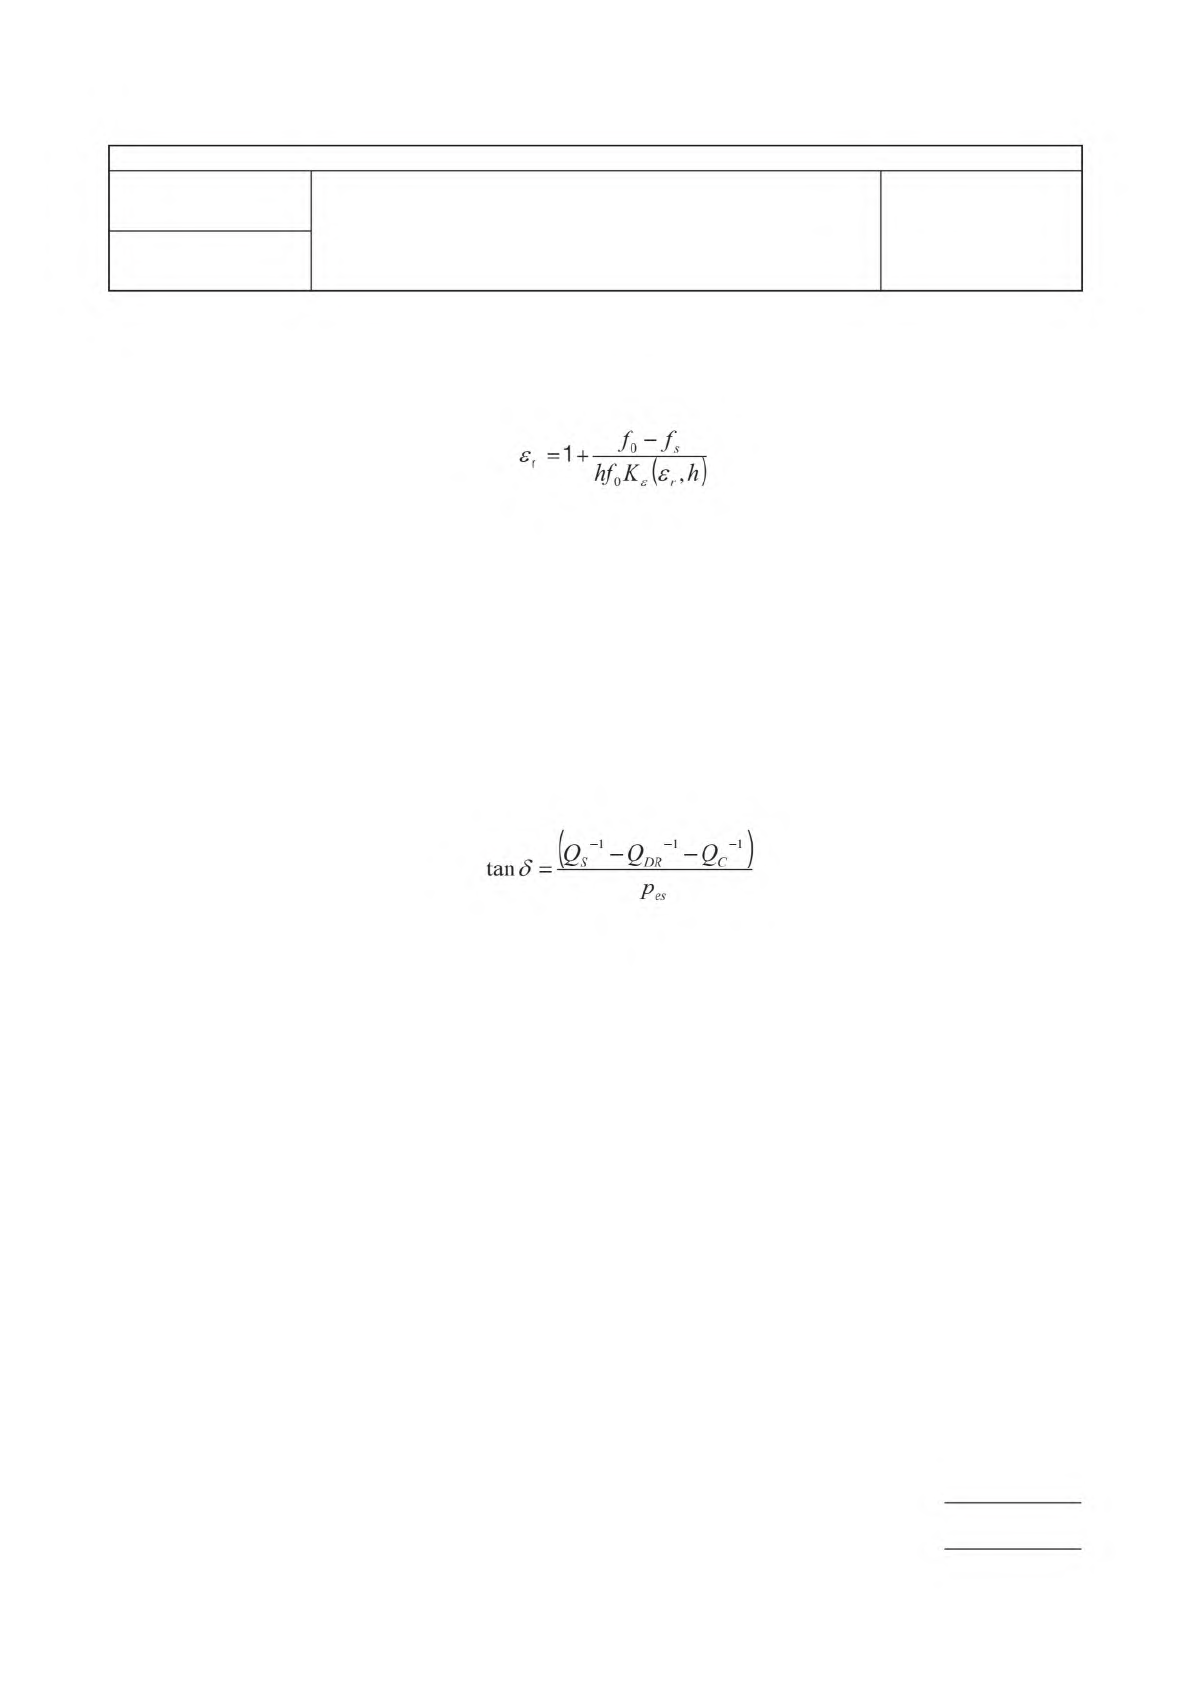
The relative permittivity (
e
r
) shall be calculated according to Equation (1).
(1)
where
e
r
is relative permittivity;
h is the thickness of the specimen under test, mm;
f
0
is the resonant frequency of empty SPDR Fixture;
f
s
is the resonant frequency of resonator with the dielectric specimen;
K
e
(
e
r
, h) is a function of
e
r
and h. For a fixed resonant cavity, its physical parameters (size, dielectric resonators
e
r
) should have been
identified. K
e
(
e
r
, h) is pre-computed and tabulated by electromagnetic field simulation with the strict Rayleigh-Ritz method. Put
the empty SPDR frequency (f
0
), the resonant frequency with dielectric specimen (f
s
) and the thickness of the specimen (h) under
test into Equation (1). Enter a similar arbitrary value of the relative permittivity of the sample, and use a successive approximation
algorithm. After several iterations, end the calculation when the relative error of the last two calculated relative permittivities is
less than 0.1 %. The last calculated data is taken as the relative permittivity of the specimen.
The loss tangent shall be calculated according to Equation (2).
(2)
where
tan
d
is loss tangent;
Q
s
is the unloaded Q-factor of a resonant fixture containing the specimen;
Q
c
is the Q-factor depending on metal losses for the resonant fixture containing the specimen;
Q
DR
is the Q-factor depending on dielectric losses in dielectric posts for fixture containing the specimen;
p
es
is electromagnetic energy filling factor of the specimen. After identifying the physical parameters of resonant cavity,
the electromagnetic energy filling factor pes can be determined by electromagnetic field simulation. For a fixed
resonant cavity, pes is a constant value. Some additional information is showed in Annex B.
5.2.8
Measure the two remaining specimens by repeating steps 5.2.3 through 5.2.7.
5.2.9
If another test frequency is selected, change the SPDR test fixture in accordance with the test frequency. And then repeat
steps 5.2.2 through 5.2.7.
5.3
Testing of relative permittivity and loss tangent at variable temperatures
5.3.1
The ambient test temperature should be 23 °C ± 2 °C [73.4 ± 3.6 °F]. The variation should not exceed 1°C [1.8 °F] during
the test. Allow at least 30 minutes for the VNA to warm up.
5.3.2
Select a SPDR test fixture in accordance with the test frequency. The specimen size and thickness shall comply with
requirements specified in Table 1. For example, if the test frequency is 10 GHz, a SPDR test fixture with 10 GHz nominal
frequency should be selected. The supported specimen size is 80 mm × 80 mm [3.2 X 3.2 inch] and the maximum thickness
of specimen is no more than 0.9 mm [0.035 inch]. Connect the SPDR test fixture to VNA. The test fixture shall be kept in a
horizontal position in the test chamber. Set the VNA parameters according to the manufacturer’s instructions and the nominal
frequency of the SPDR fixture.
Page 5 of 7
2.5.5.15
RelativePermittivityandLossTangentUsinga
06/22
Split-PostDielectricResonator
N/A
=1
1
/
_/
伉七(
凡㈤
tan
5
(0s
'
-
Qdr
I
-
Cc
I
)
Pes

IPC-TM-650
Number Subject Date
Revision
2.5.5.15
RelativePermittivityandLossTangentUsinga
06/22
Split-PostDielectricResonator
N/A
Page 6 of 7
5.3.3
Adjust the test temperature of the test chamber. After reaching the set temperature (T), hold it for at least 15 minutes.
Measure resonance frequency
f
0
(T) and Q-factor Q
0
(T) of the empty resonator.
Note:
The resonance peak should be between -40 dB and -45 dB. Adjust the position of the coupling loops to achieve this
range ensuring their position is symmetrical. When measuring the Q-factor, the frequency span of the VNA shall be adjusted
such that it is between 110 % and 200 % of the full width at half maximum of the resonant curve.
5.3.4
Utilize a micrometer to measure the thickness of the specimen, record as h. The environmental test chamber shall be
returned to room temperature. Insert the specimen into the test fixture. The side with marking is face up and the edge of this
side has to be aligned with the fixture edge.
5.3.5
Repeat step 5.3.3. Measure the resonance frequency
f
s
(T) and Q-factor Qs(T) of the resonator with the specimen at
temperature T.
Note:
When measuring the Q-factor, the frequency span of the VNA should be adjusted such that it is between 110 % and 200
% of the full width at half maximum of the resonant curve.
5.3.6
Calculate following the instructions in step 5.2.7, the value of the relative permittivity Dk(T) and the loss tangent Df(T)
at temperature T.
5.3.7
If another test temperature is required, repeat steps 5.3.2 through 5.3.6 at the new temperature.
5.3.8
Thermal coefficient of relative permittivity
e
r
(short for TC
e
r
) is the change rate of relative permittivity per temperature
change. The unit of TC
e
r
is 10
-6
/°C. Generally, the relative permittivity of a specimen at its base temperature T
ref
of 23 °C
(is used as the base relative permittivity Dk(T
ref
). For temperature T, TC
e
r
shall be calculated according to Equation (3).
X 10
6
(3)
where
TC
e
r
is thermal coefficient of
e
r
, 10-
6
/°C;
T is test temperature, °C;
T
ref
is base temperature, °C;
Dk(T) is relative permittivity at temperature T;
Dk(T
ref
) is relative permittivity at temperature T
ref
.
5.3.9
The thermal coefficient of tan
d
(TC tan
d
) is the change in rate of loss tangent per temperature (every increase or decrease
1°C [1.8°F]. The unit of TC tan
d
is 10
-6
/°C. Generally, the loss tangent of specimen at base temperature T
ref
of 23 °C [73.4 °F]
is used as the base loss tangent Df(T
ref
). For temperature T, TC tan
d
is calculated according to the Equation (4).
X 10
6
(3)
where
TC tan
d
is thermal coefficient of tan
d
, ppm/°C;
T is the test temperature, °C;
T
ref
is base temperature, °C;
Df(T) is loss tangent at temperature T;
Df(T
ref
) is loss tangent at temperature T
ref
.
―
Dkg-
Dkg
3
飞-力
x
Dkg
(
T-T]xDf(Tf