IPC-TM-650 EN 2022 试验方法--.pdf - 第633页
5.2.8.5 When an individual c oupon delta reaches t he rej ec- tion resistance, Method A stress cycle testing is stopped for the coupon. The re jection criteria pr ovides for early interven- tion so f ailure analysis act …
ANSI/J-STD-001
IPC-TM-650
The Institute for Interconnecting and Packaging Electronic Circuits
2215 Sanders Road • Northbrook, IL 60062
Material in this Test Methods Manual was voluntarily established by Technical Committees of the IPC. This material is advisory only
and its use or adaptation is entirely voluntary. IPC disclaims all liability of any kind as to the use, application, or adaptation of this
material. Users are also wholly responsible for protecting themselves against all claims or liabilities for patent infringement.
Equipment referenced is for the convenience of the user and does not imply endorsement by the IPC.
Page 1 of 4
Number
IPC-TM-650
TEST
METHODS
MANUAL
Subject
Measurement
of
Electrical
Overstress
from
Soldering
Hand
Tools
-
Transient
Measurements
Originating
Task
Group
Manual
Soldering
Task
Group
(5-22c)
Date
11/98
Revision
1
Scope
This
test
method
deals
only
with
transients
gener¬
ated
within
the
Unit
Under
Test
(UUT)
and
not
with
transients
originating
elsewhere
(i.e.,
power
line
transients),
which
propa¬
gate
through
the
UUT.
This
procedure
measures
transient
voltage
events
appearing
at
the
hot
tip
of
an
electric
hand
soldering/desoldering
tool,
which
could
be
seen
by
the
workpiece.
The
test
electrode
and
measuring
equipment
represent
a
workpiece
having
a
high
impedance.
There
are
two
times
when
transients
testing
should
be
done:
•
Equipment
qualification
for
purchase
•
Incoming
inspection
of
new
or
repaired
equipment
A
storage
oscilloscope
is
used
to
observe
and
measure
tran¬
sient
events.
The
test
electrode
is
coupled
to
the
vertical
input
of
the
oscilloscope
via
a
1
0
MQ
probe.
The
UUT
may
be
iso¬
lated
from
ambient
electronic
noise
by
placing
it
in
a
screen
room
or
shielded
enclosure
and
supplying
filtered
AC
power.
Inside
the
shield,
the
hot
tip
of
the
UUT
is
touched
to
the
test
electrode.
This
test
may
be
falsely
influenced
by
radio
frequency
interfer¬
ence
and
electromagnetic
interference
from
lighting
and
equipment
found
in
the
workplace
and
testing
area.
This
will
normally
be
demonstrated
by
ambient
transients
of
1
.5
V
peak
being
present.
At
a
minimum,
shielded
test
leads
should
be
utilized.
To
avoid
these
influences
it
may
be
necessary
to
per¬
form
the
leakage
and
transient
tests
in
a
screen
room.
In
lieu
of
a
screen
room
a
separate
test
procedure,
see
Method
2.5.33.4,
which
makes
a
low
cost
shielded
enclosure,
which
should
provide
adequate
shielding
for
the
performance
of
these
test
procedures.
Warning:
This
is
a
laboratory
test
procedure
that
may
of
necessity
expose
terminals
that
carry
line
voltages.
All
stan¬
dard
laboratory
safety
procedures
regarding
the
setup
and
performance
of
tests
with
line
voltage
equipment
must
be
observed
at
all
times.
Caution:
This
test
is
performed
with
soldering
systems
at
their
normal
operating
temperature.
Test
personnel
must
take
adequate
precautionary
steps
to
protect
themselves
and
oth¬
ers
from
potential
burns.
2
Applicable
Documents
Requirements
for
Soldered
Electrical
and
Electronic
Assemblies
Test
Methods
Manual
2.5.33
Measurement
of
Electrical
Overstress
from
Solder¬
ing
Hand
Tools
2.5.33.4
Measurement
of
Electrical
Overstress
from
Solder¬
ing
Hand
Tools
-
Shielded
Enclosure
3
Test
Specimens
Test
specimens
for
this
procedure
are
detailed
in
Method
2.5.33.
4
Equipment/Apparatus
Apparatuses
utilized
by
the
pro¬
cedures
that
make
up
this
test
method
are
given
in
4.1
through
4.5.2.
4.1
Test
electrode
(see
Section
3)
4.2
Storage
oscilloscope,
100
Mhz
bandwidth
or
faster,
1
MQ
input
vertical
amplifier
4.3
Power
line
filter,
20
ampere
@115
VAC,
50
dB
insertion
loss
@
5
Mhz/50Q
4.4
Oscilloscope
probe
-
X10
Attenuation
4.5
Optional
4.5.1
Screen
camera,
diskette,
or
hard
copy
waveform
printer
4.5.2
Screen
room
or
shielded
enclosure
capable
of
accom¬
modating
the
entire
UUT,
cord,
and
handpiece.
A
filtered
AC
power
receptacle
shall
be
available
from
within
(see
Method
2.5.33.4).
4.6
Preparation
of
Apparatus
Turn
on
the
oscilloscope
and
allow
it
to
warm
up.
Connect
the
UUT
to
a
shielded
AC
line
filter
assembly
as
shown
in
Figure
1
and
configure
for
typical
operation.
Note:
The
plugs
are
in
power
receptacles
during
measure¬
ments.
They
are
shown
unplugged
in
Figure
1
for
clarity.
5.2.8.5
When an individual coupon delta reaches the rejec-
tion resistance, Method A stress cycle testing is stopped for
the coupon. The rejection criteria provides for early interven-
tion so failure analysis activities can try to find the root cause
for the failure with minimal collateral damage from the stress
cycle.
5.2.8.6
The heating and cooling resistance data is compiled
for each coupon’s performance throughout the stress testing.
The system software provides a download file to graph the
coupon’s performance. Data is compiled to create graphs of
each coupon’s performance throughout stress testing.
5.2.8.7
The data is tabulated into a test report for analysis.
5.2.8.7.1 Tabulation of Results for Single Sense
Testing
The test data should be organized to provide the
following:
• Test Coupon Description
• Test Parameters
• Sample ID
• Power Circuit (P) Cycles to Failure or End of Test
• Power Circuit Percent Change
• Sense Circuit (S) Cycles to Failure or End of Test
• Sense Circuit Percent Change
• Disposition of Test Results
5.2.8.7.2 Tabulation of Results for Dual Sense Testing
The test data should be organized to provide the same data
as described in 5.2.8.7.1 with the addition of the following:
• Sense Circuit (S1,S2) Cycles to Failure or End of Test
• Sense Circuit (S1,S2) Percent Change
5.2.8.8
The resistance data for the coupons are plotted on
resistance graphs to indicate how damage is accumulated
over the test cycles.
5.2.8.9 Microsection (Optional)
An appropriate number
of coupons are selected for microsection review. A small cur-
rent is placed on the failing circuit and observed under a ther-
mal camera (see 6.2 and Figure 6-1). The most damaged
interconnection is selected for microscopic review.
5.2.8.10
Review all the tabulated data for a determination of
the disposition of the coupons.
5.3 Method B Procedure
5.3.1
Unless otherwise specified by the user, the default test
condition be Tin/Lead Reflow in accordance with Table
5-2.
5.3.2 Assembly Precondition (Optional)
See Table 5-2
Note 1. See also 6.1.
5.3.3 Temperature Coefficient of Resistance Test
Sequence
The TCR is calculated once for each unique cou-
pon type or cell. Once determined, that TCR is used for
Method B testing of all coupons of that type or cell. Examples
of elements that can affect the TCR and therefore define a
coupon type/cell are: via structure (thru holes vs. buried vias
vs. microvias, etc.), via diameter, via length, total board thick-
ness, laminate/resin material, plating chemistry, type of via fill,
and surface finish.
5.3.3.1 Temperature Coefficient of Resistance
Deter-
mine the TCR of each unique coupon type or cell using the
average value from 2 to 4 coupon samples. Attach coupons
to each quick connect test fixture and close the oven door. A
Tin/Lead
Reflow
(Default)
8
23 to 220 °C
[73 to 428 °F]
5% per cycle or
10% from first
cycle
10
1 second
intervals
3°C / second 40 seconds
Lead-Free
Reflow
8
23 to 245 °C
[73 to 473 °F]
5% per cycle or
10% from first
cycle
10
1 second
intervals
3°C / second 40 seconds
These default test conditions represents assembly conditions, and therefore assembly preconditioning is not required. The available temperature test range
is from 23 to 300 °C [73 to 572 °F] to any number of cycles.
See 5.3.5.
Number
2.6.26
Subject
DC Current Induced Thermal Cycling Test
Date
5/14
Revision
A
IPC-TM-650
shall
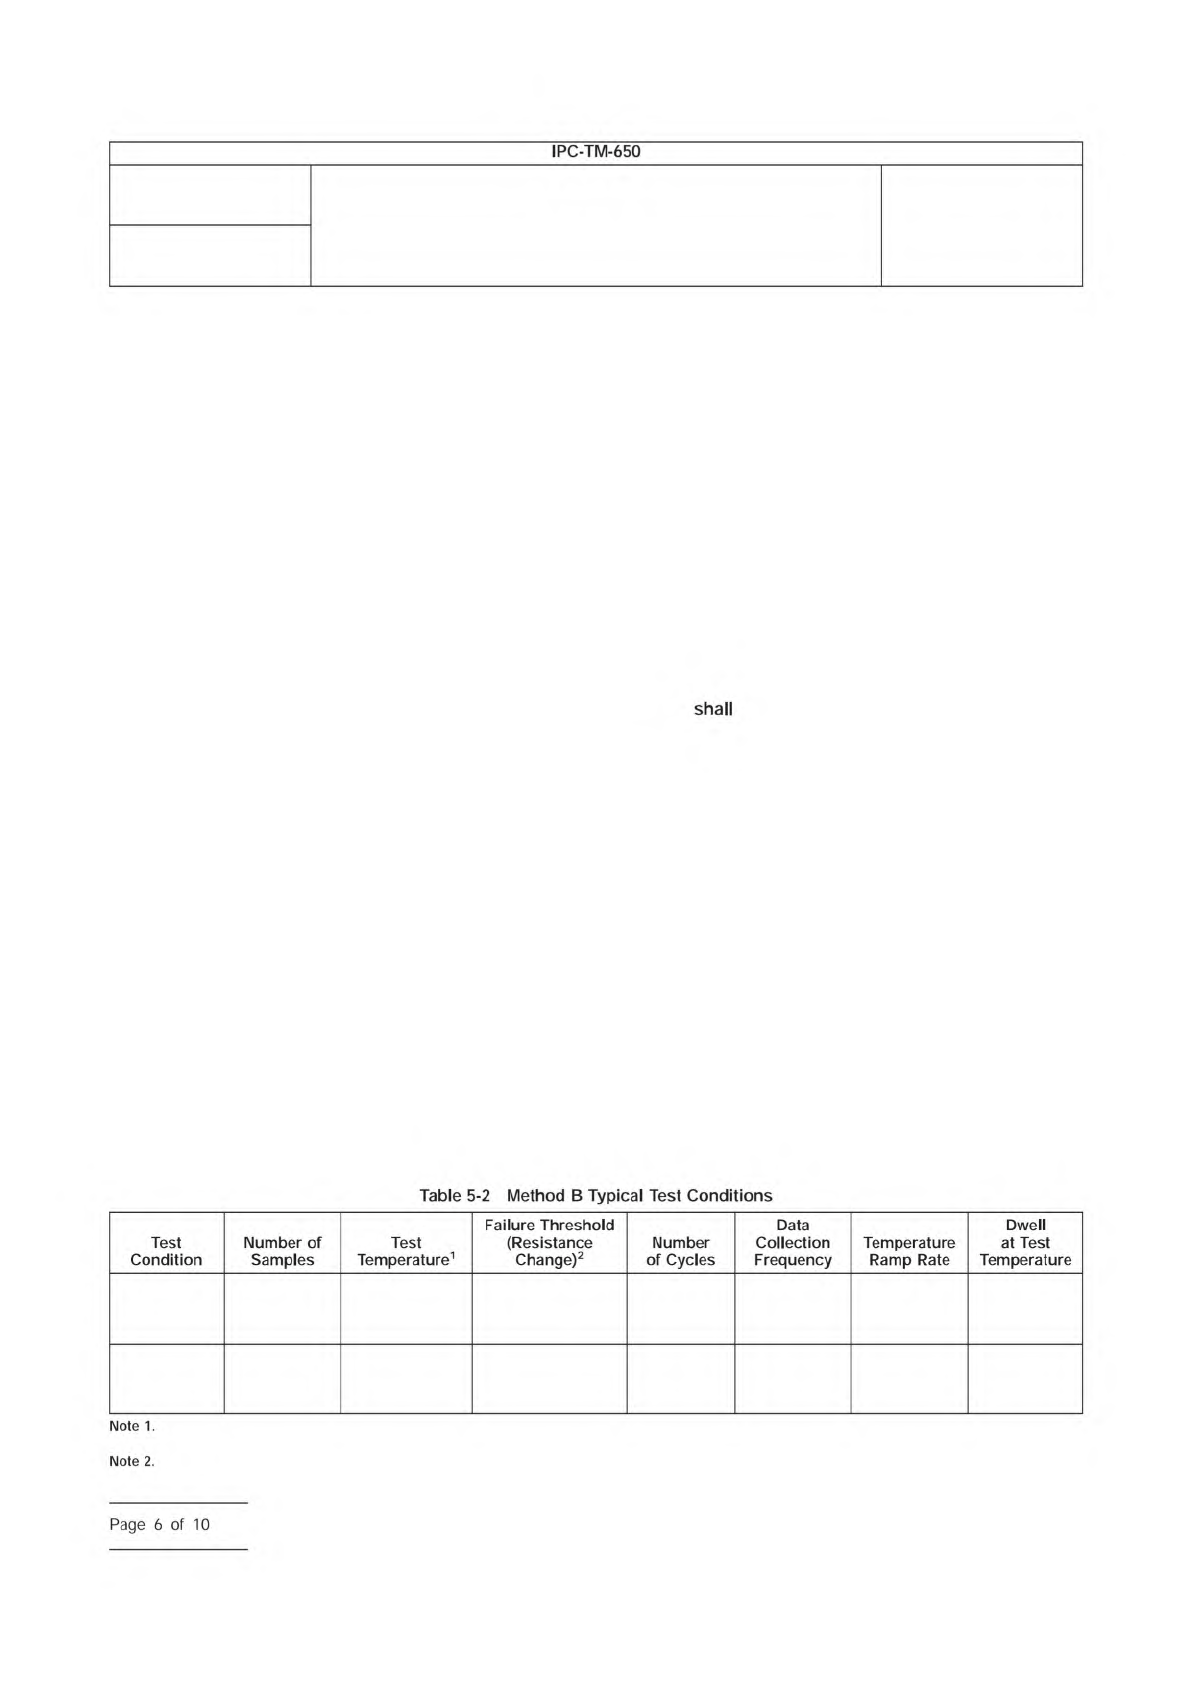
Table
5-2
Method
B
Typical
Test
Conditions
Note
1.
Test
Condition
Number
of
Samples
Test
Temperature1
Failure
Threshold
(Resistance
Change)2
Number
of
Cycles
Data
Collection
Frequency
Temperature
Ramp
Rate
Dwell
at
Test
Temperature
Note
2.
Page
6
of
10

computer controls the oven temperature through a range of
temperatures from 23 °C to 260 °C [73 to 500 °F]. The com-
puter monitors and records the equilibrium resistance for each
temperature. The equation used to calculate the TCR for each
tested coupon is as follows:
TCR(T) =
(Rh − Rrm)
(Th − Trm) x Rrm
where:
TCR(T) = Calculated TCR for the coupon as a function of
intended Method B Test Temperature T
Th = Temperature of coupon at oven temperature
Rh = Resistance of coupon at oven temperature
Rrm = Resistance of coupon at ambient temperature
Trm = Ambient Temperature (approximately 23 °C [73 °F])
5.3.4 Stress Cycle Definition
The system calculates and
displays the coupon test temperature with the following equa-
tion:
T = Trm +
(R − Rrm)
(Rrm x TCR(T))
where:
TCR(T) = Measured thermal coefficient of resistance for this
type/cell of coupons (see 5.3.3.1)
Rrm = Resistance of coupon at ambient temperature
measured at start of each cycle
T = Coupon test temperature calculated at 1 second
intervals
R = Coupon resistance measured at 1 second intervals
Trm = Ambient temperature measured at each cycle
(approximately 23 °C [73 °F])
Alternately, this equation may be expressed in terms of the
target resistance that is equivalent to the targeted high tem-
perature for that coupon and cycle, as follows:
Target Resistance = Rrm x (1 + TCR(Th)[Th - Trm])
where:
Th = Target high test temperature
5.3.5 Failure Threshold
Three different failure criteria or a
combination of these three may be used for a Method B cycle
as shown below. Refer to definitions for the variable names
and the equation for Target Resistance in 5.3.3.
1) R-high. During any single cycle, R exceeds target value by
more than R1% (default R1 = 5%) anytime during cycle,
that is,
R-high failure threshold: R > Target Resistance x (1 + R1).
2) R-low. During any single cycle, the final Rrm(n) after cool-
ing is greater than Rrm(n-1) of the previous cycle by more
than R2% (default R2 = 5%), that is
R-low failure threshold: Rrm(n) Rrm(n-1) x (1 + R2).
3) R-delta. Coupon is failed at cycle n if the final Rrm(n) after
cooling is equal to or greater than R3% (default R3=10%)
change from Rrm(0) at the start of test prior to cycle 1.
R-delta Failure Threshold: Rrm(n) > Rrm(0) x (1 + R3).
5.3.6 Stress Cycle Test Sequence
The following para-
graphs detail the sequence for a single coupon; however this
sequence is done at all test heads simultaneously.
5.3.6.1
Stress test coupons are placed in the table top test
fixture. The test fixture includes a cooling fan and quick con-
nect housings for the test coupons.
5.3.6.2
The Method B test system uses the TCR and asso-
ciated equation (see 5.3.3) to heat the coupon with DC cur-
rent (variable level determined in 1 second intervals) to the
prescribed ramp rate and high test temperature. The com-
puter also monitors and records the relative changes in resis-
tance of the plated barrel throughout the heating cycle.
5.3.6.3
The dwell time at test temperature is followed by
forced air cooling. Cooling time is a function of overall thick-
ness and construction of the coupon. The computer monitors
and records the coupon’s performance throughout the cool-
ing cycle.
5.3.6.4
The individual coupons are continually thermal
cycled using their customized heating and cooling conditions
until one of the rejection criteria is achieved or the maximum
number of cycles is completed.
5.3.6.5
The heating and cooling resistance data is compiled
for each coupon’s performance throughout the stress testing.
The system software provides a download file to graph the
coupon’s performance. Data is compiled to create graphs of
each coupon’s performance throughout stress testing.
5.3.7 Graphing and Data Analysis
5.3.7.1 Tabulation of Results
Test results are typically
reported with the following information:
• Test Coupon Description
• Test Parameters: Temperature(s), ramp rate, dwell
Number
2.6.26
Subject
DC Current Induced Thermal Cycling Test
Date
5/14
Revision
A
IPC-TM-650
Page
7
of
10