IPC-TM-650 EN 2022 试验方法--.pdf - 第630页
Figure 1 T est A pparatus 10 MA. CURRENT SOURCE GROUND REFERENCE POINT MILLI- VOL T METER + + + ELECTRODE ( ) UNIT UNDER TEST (UUT) TEST ELECTRODE ( ) Figure 2 Blo ck Diagram of T est Apparatus UUT 10 MA CURRENT REGULA T…
5.2.2
Position the coupons at each test head by attaching
male to female connectors.
5.2.3 Baseline Performance (Optional)
Establish a per-
formance baseline by completing two Method A cycles and
then stop the test at the end of the cooling cycle.
5.2.4 Capacitance Test (Optional)
If required, the capaci-
tance test
be performed per IPC-TM-650, Method
2.5.35.
5.2.5 Assembly Precondition (Optional)
Assembly pre-
conditioning is recommended to simulate the assembly envi-
ronment to which the printed boards are exposed (see 6.1).
5.2.6
Unless otherwise specified by the user, test all via
types and materials per the default test condition in accor-
dance with Table 5-1. For testing of samples containing
microvia structures, use the microvia test condition. For test-
ing of samples containing polyimide materials, use the polyim-
ide test condition.
5.2.7 Pre-Cycling Test Sequence
The following para-
graphs detail the sequence for a single coupon, however this
sequence is done at all test heads simultaneously. The ambi-
ent resistance, resistance at test temperature, rejection resis-
tance, and current are calculated for each coupon and dis-
played on the PC monitor.
IPC-2626-5-1
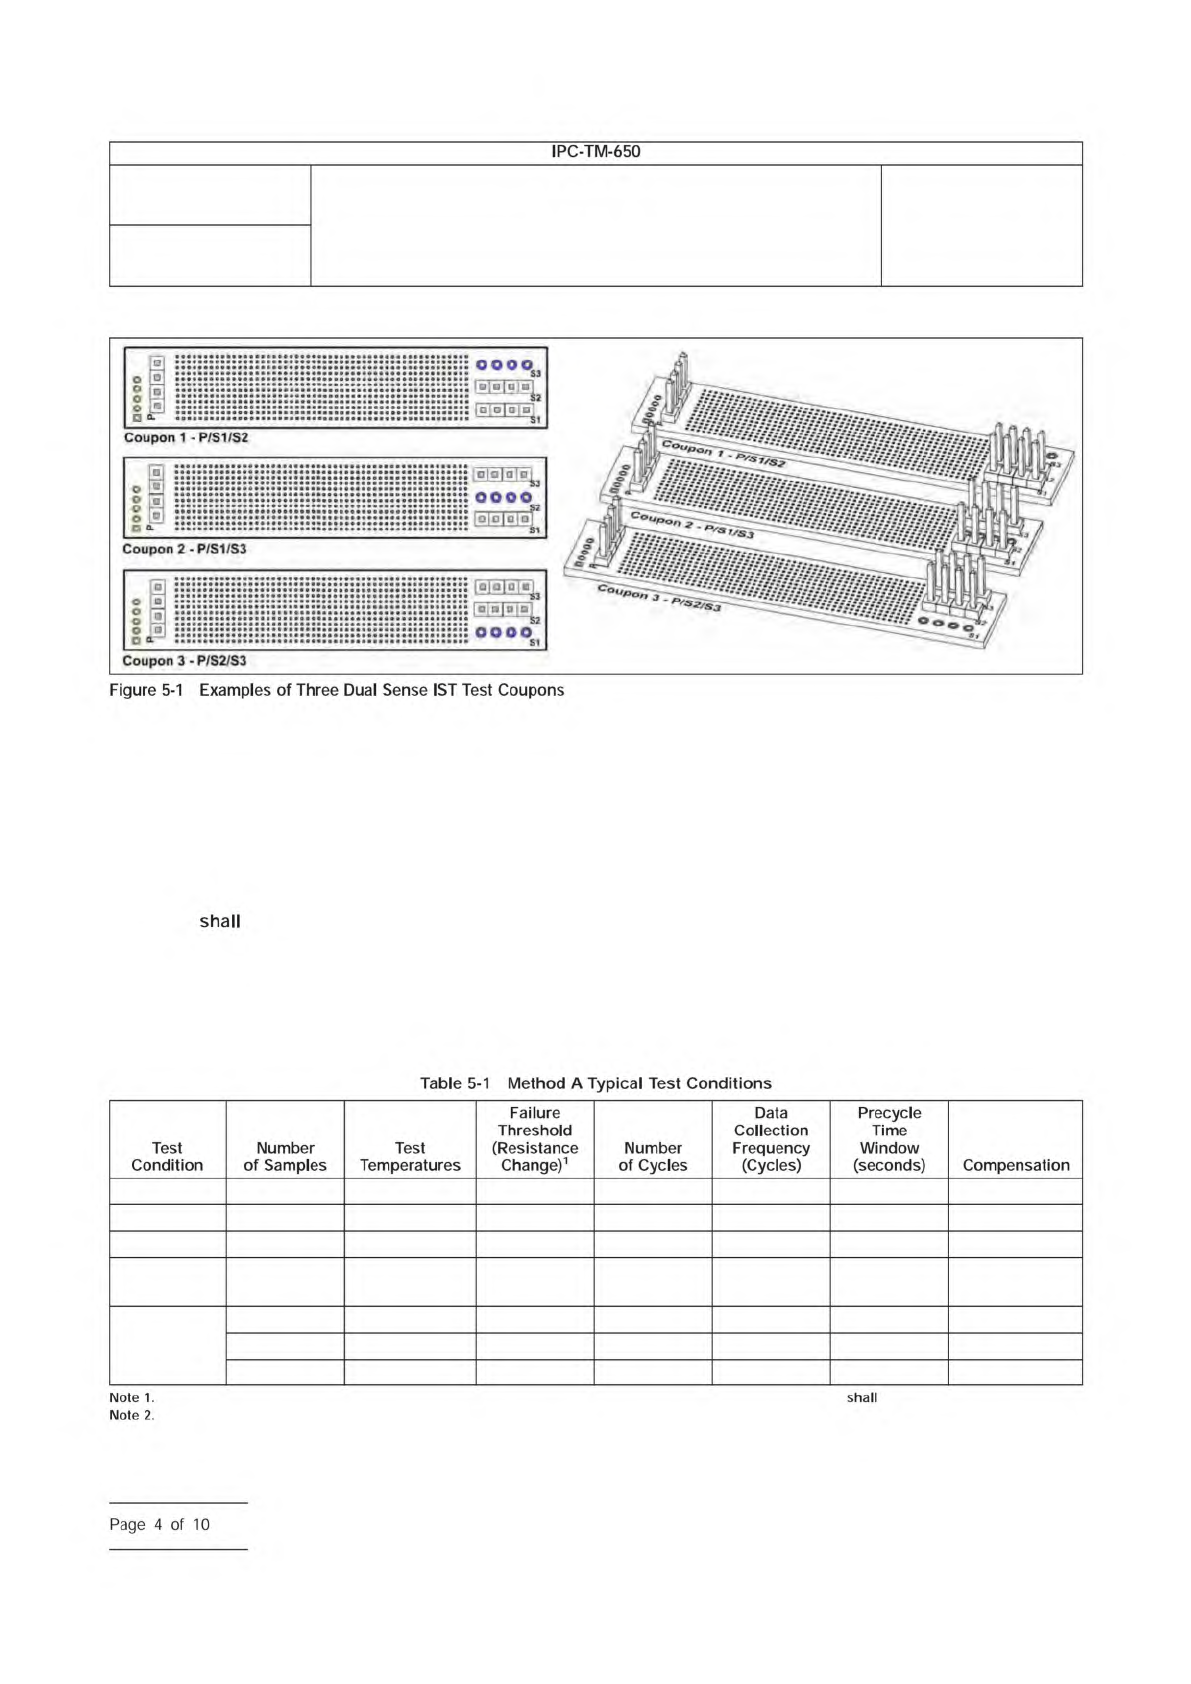
(Top-Down View as shown at left and Isometric View as shown at right)
Default 6 150 °C 10% 250 25 3 Calculated
Polyimide 6 AABUS 10% 250 25 3 Calculated
Microvias
2
6 190 °C 10% 250 25 3 None
Polyimide
Microvias
2
6 AABUS 10% 250 25 5 None
Survivability
Testing
6 230 °C 10% 10 1 5 None
6 245 °C 10% 10 1 5 None
6 260 °C 10% 10 1 5 None
For Dual Sense Testing, both the ‘‘Cycle Using’’ and the ‘‘Cycle Failing On’’ fields on the Method A test equipment be set to ‘both sense circuits.’
Power on the microvia or heating trace net.
Number
2.6.26
Subject
DC Current Induced Thermal Cycling Test
Date
5/14
Revision
A
IPC-TM-650
[0同可&
回叫
oooo
Coupon
1
-P/S1/S2
Coupon
2
-
P/S1/S3
Coupon
3
-
P/S2/S3
Figure
5-1
Examples
of
Three
Dual
Sense
1ST
Test
Coupons
shall
Table
5-1
Method
A
Typical
Test
Conditions
Note
1.
Note
2.
Test
Condition
Number
of
Samples
Test
Temperatures
Failure
Threshold
(Resistance
Change)1
Number
of
Cycles
Data
Collection
Frequency
(Cycles)
Precycle
Time
Window
(seconds)
Compensation
0000c
-n
p-d
O0O0D
d
OOOOQ
Page
4
of
10
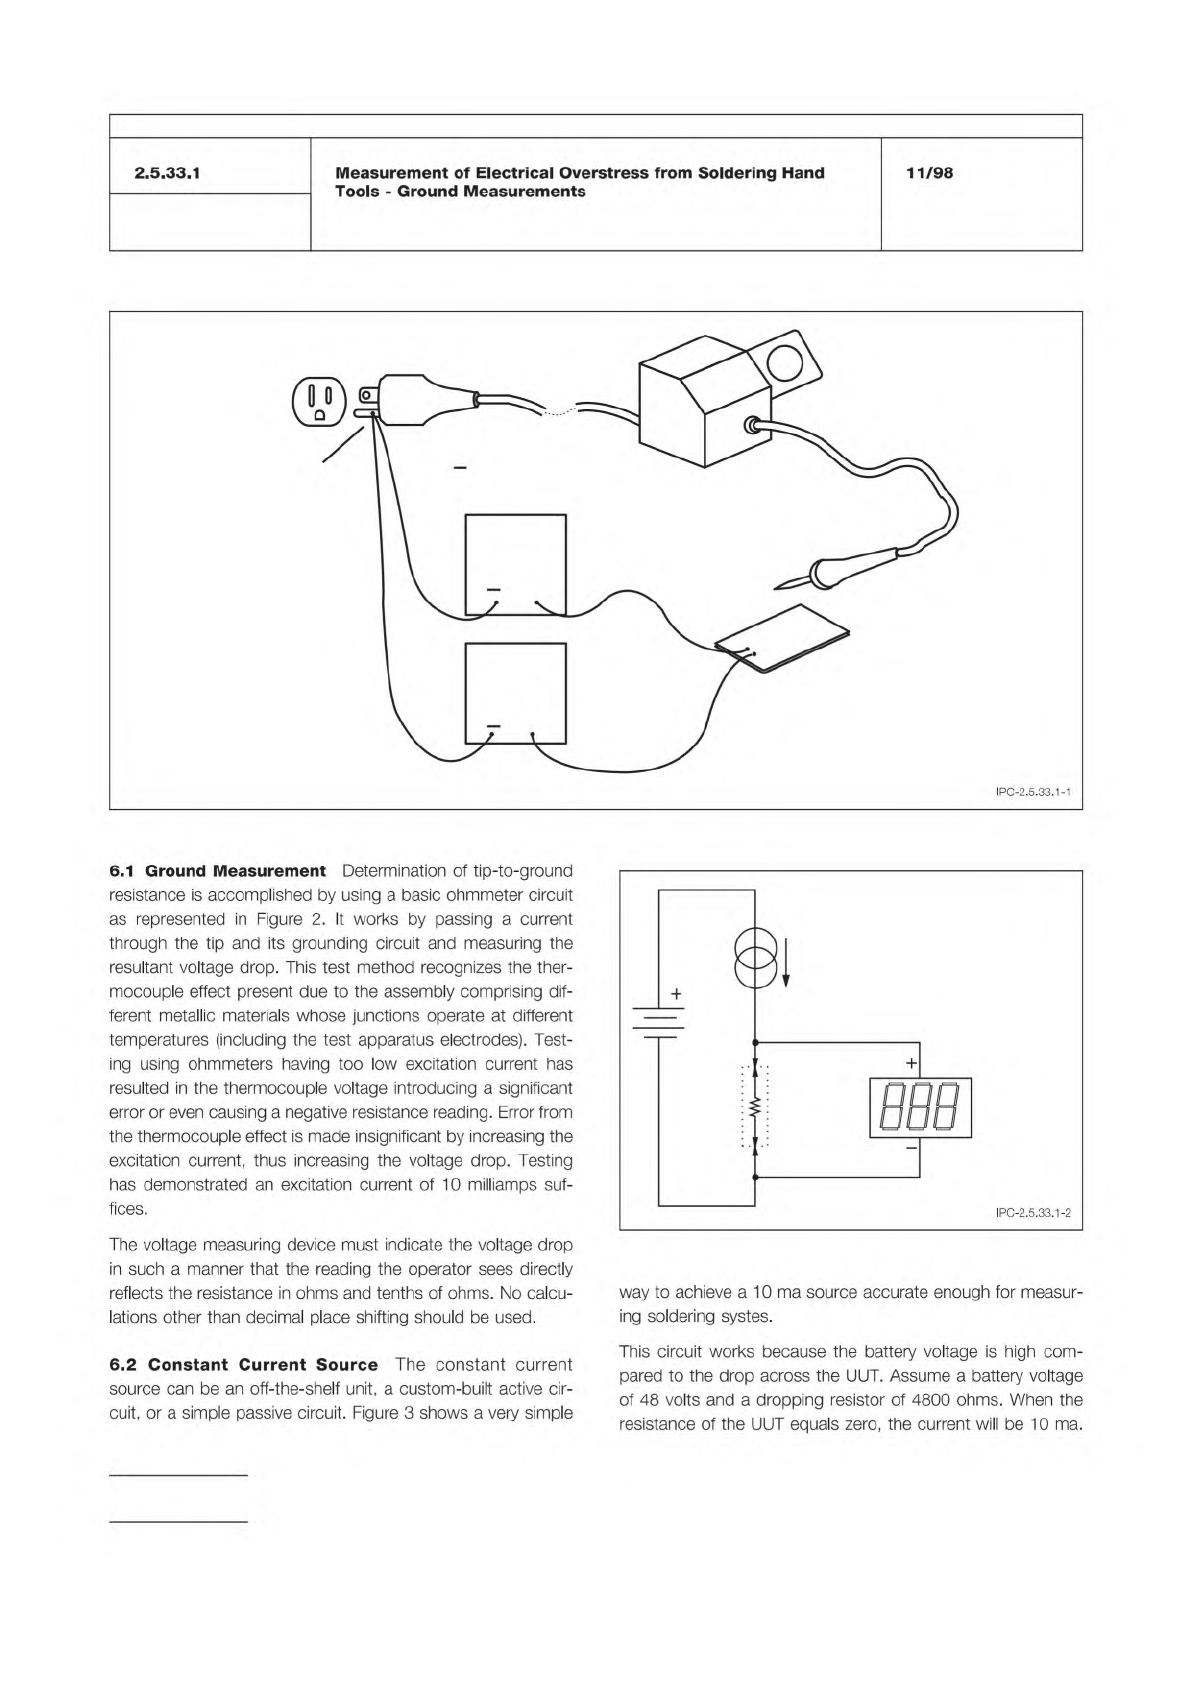
Figure 1 Test Apparatus
10 MA.
CURRENT
SOURCE
GROUND
REFERENCE
POINT
MILLI-
VOL
T
METER
+
+
+
ELECTRODE
( )
UNIT UNDER
TEST (UUT)
TEST
ELECTRODE ( )
Figure 2 Block Diagram of Test Apparatus
UUT
10 MA
CURRENT
REGULATOR
MILLIVOLT
METER
IPC-TM-650
Number
Subject Date
Revision
Page 2 of 3
2.5.33.1
Measurement
of
Electrical
Overstress
from
Soldering
Hand
Tools
-
Ground
Measurements
11/98
IPC-2.5.33.1-1
6.1
Ground
Measurement
Determination
of
tip-to-ground
resistance
is
accomplished
by
using
a
basic
ohmmeter
circuit
as
represented
in
Figure
2.
It
works
by
passing
a
current
through
the
tip
and
its
grounding
circuit
and
measuring
the
resultant
voltage
drop.
This
test
method
recognizes
the
ther¬
mocouple
effect
present
due
to
the
assembly
comprising
dif¬
ferent
metallic
materials
whose
junctions
operate
at
different
temperatures
(including
the
test
apparatus
electrodes).
Test¬
ing
using
ohmmeters
having
too
low
excitation
current
has
resulted
in
the
thermocouple
voltage
introducing
a
significant
error
or
even
causing
a
negative
resistance
reading.
Error
from
the
thermocouple
effect
is
made
insignificant
by
increasing
the
excitation
current,
thus
increasing
the
voltage
drop.
Testing
has
demonstrated
an
excitation
current
of
10
milliamps
suf¬
fices.
The
voltage
measuring
device
must
indicate
the
voltage
drop
in
such
a
manner
that
the
reading
the
operator
sees
directly
reflects
the
resistance
in
ohms
and
tenths
of
ohms.
No
calcu¬
lations
other
than
decimal
place
shifting
should
be
used.
6.2
Constant
Current
Source
The
constant
current
source
can
be
an
off-the-shelf
unit,
a
custom-built
active
cir¬
cuit,
or
a
simple
passive
circuit.
Figure
3
shows
a
very
simple
way
to
achieve
a
10
ma
source
accurate
enough
for
measur¬
ing
soldering
systes.
This
circuit
works
because
the
battery
voltage
is
high
com¬
pared
to
the
drop
across
the
UUT.
Assume
a
battery
voltage
of
48
volts
and
a
dropping
resistor
of
4800
ohms.
When
the
resistance
of
the
UUT
equals
zero,
the
current
will
be
10
ma.

5.2.7.1 Ambient Resistance
The auto ranging multimeter
measures the ambient resistance (voltage drop) of the net that
heats the coupon with DC current.
5.2.7.2 Resistance at Test Temperature
The system
software calculates and displays the resistance at the test
temperature. The available stress testing range is from 50 -
270 °C [122 - 518 °F]. The equation used to calculate the tar-
get resistance is as follows:
Target Resistance = Rrm x (1 + αT [Th - Trm])
where:
αT = Estimated thermal coefficient of resistance for the inter-
connect
Rrm = Resistance of coupon at ambient temperature
Th = Test temperature
Trm = Ambient Temperature (approximately 25 °C [77 °F])
5.2.7.3 Failure Threshold
The system software calculates
and displays the resistance change. This is adjustable from a
1% to a 100% increase. The typical failure threshold value is a
10% change in resistance. The equation to calculate the fail-
ure threshold is as follows:
Failure Threshold = (RT1 x Rr) + RT1
where:
Failure Threshold is in resistance
RT1 = Resistance of coupon at test temperature for Cycle 1
Rr = Resistance change (typically 10%)
5.2.7.4 Current
The system selects an initial current based
on the ambient resistance of the coupon and the current
table. The current tables are derived from software libraries on
the Method A test equipment. During the pre-cycling
sequence, the initial current is adjusted for each coupon to
assure the test temperature resistance is achieved in three
minutes ± precycle time window (see 5.2.7.5).
Additional equations/algorithms used by Method A
that establish the initial current selection for pre-cycling, rela-
tive to the relationship of coupon interconnect resistance αT,
coupon construction and stress test temperature to be
achieved are considered proprietary at this time.
5.2.7.5 Pre-Cycling
Pre-cycling is initiated by the applica-
tion of the selected current to the coupon; the computer
monitors the coupon’s performance throughout a 30 second
and 60 second cycle. The resistance level is monitored and
the current is adjusted based on the resistance reading.
These short duration tests adjust the current to prevent the
coupon heating rate being too fast on the first pre-cycle. The
computer monitors and records the coupon’s performance on
the first pre-cycle. If at the end of the first pre-cycle, the cou-
pon achieves the specified resistance level in three minutes ±
precycle time window, it will be accepted for subsequent
stress testing. If the resistance value was not achieved in this
time frame, the coupon will automatically be pre-cycled again
with a revised or compensated current. The system will retest
using revised conditions until all coupons are accepted or
rejected for stress testing.
The equation(s)/algorithms used by Method A to com-
pensate the DC current are considered proprietary at the time
of publication of this method revision.
5.2.7.6
Forced air cooling is commenced after each pre-
cycle to cool the coupons to ambient temperature.
5.2.7.7
The system automatically records and saves all
information regarding the pre-cycling conditions for subse-
quent stress testing.
5.2.8 Stress Cycle Test Sequence
The following para-
graphs detail the sequence for a single coupon; however this
sequence is done at all test heads simultaneously.
5.2.8.1
When the pre-cycle sequence is complete, the
Method A stress test is initiated by applying the same DC cur-
rent level established for each individual coupon during the
pre-cycle operation for three minutes. The computer monitors
and records the relative changes in resistance of the plated
barrel and internal connections throughout the heating cycle.
5.2.8.2
The three minutes of heating is followed by forced
air cooling. Cooling time is a function of overall thickness and
construction of the coupon. The computer monitors and
records the coupon’s performance throughout the cooling
cycle.
5.2.8.3
The individual coupons are placed on the tester and
are continually thermal cycled using their customized heating
and cooling conditions until the rejection criteria is achieved or
the maximum number of cycles is completed.
5.2.8.4
The coupon’s resistance ‘‘delta’’ (the variance from
resistance of coupon at test temperature for Cycle 2)
increases (positively) as failure inception occurs. The rate of
change in the delta is indicative of the mechanical change
(failure) within the barrel and/or internal connections.
Number
2.6.26
Subject
DC Current Induced Thermal Cycling Test
Date
5/14
Revision
A
IPC-TM-650
NOTE:
NOTE:
Page
5
of
10