IPC-TM-650 EN 2022 试验方法--.pdf - 第761页
5.2.8.5 When an individual c oupon delta reaches t he rej ec- tion resistance, Method A stress cycle testing is stopped for the coupon. The re jection criteria pr ovides for early interven- tion so f ailure analysis act …

5.2.7.1 Ambient Resistance
The auto ranging multimeter
measures the ambient resistance (voltage drop) of the net that
heats the coupon with DC current.
5.2.7.2 Resistance at Test Temperature
The system
software calculates and displays the resistance at the test
temperature. The available stress testing range is from 50 -
270 °C [122 - 518 °F]. The equation used to calculate the tar-
get resistance is as follows:
Target Resistance = Rrm x (1 + αT [Th - Trm])
where:
αT = Estimated thermal coefficient of resistance for the inter-
connect
Rrm = Resistance of coupon at ambient temperature
Th = Test temperature
Trm = Ambient Temperature (approximately 25 °C [77 °F])
5.2.7.3 Failure Threshold
The system software calculates
and displays the resistance change. This is adjustable from a
1% to a 100% increase. The typical failure threshold value is a
10% change in resistance. The equation to calculate the fail-
ure threshold is as follows:
Failure Threshold = (RT1 x Rr) + RT1
where:
Failure Threshold is in resistance
RT1 = Resistance of coupon at test temperature for Cycle 1
Rr = Resistance change (typically 10%)
5.2.7.4 Current
The system selects an initial current based
on the ambient resistance of the coupon and the current
table. The current tables are derived from software libraries on
the Method A test equipment. During the pre-cycling
sequence, the initial current is adjusted for each coupon to
assure the test temperature resistance is achieved in three
minutes ± precycle time window (see 5.2.7.5).
Additional equations/algorithms used by Method A
that establish the initial current selection for pre-cycling, rela-
tive to the relationship of coupon interconnect resistance αT,
coupon construction and stress test temperature to be
achieved are considered proprietary at this time.
5.2.7.5 Pre-Cycling
Pre-cycling is initiated by the applica-
tion of the selected current to the coupon; the computer
monitors the coupon’s performance throughout a 30 second
and 60 second cycle. The resistance level is monitored and
the current is adjusted based on the resistance reading.
These short duration tests adjust the current to prevent the
coupon heating rate being too fast on the first pre-cycle. The
computer monitors and records the coupon’s performance on
the first pre-cycle. If at the end of the first pre-cycle, the cou-
pon achieves the specified resistance level in three minutes ±
precycle time window, it will be accepted for subsequent
stress testing. If the resistance value was not achieved in this
time frame, the coupon will automatically be pre-cycled again
with a revised or compensated current. The system will retest
using revised conditions until all coupons are accepted or
rejected for stress testing.
The equation(s)/algorithms used by Method A to com-
pensate the DC current are considered proprietary at the time
of publication of this method revision.
5.2.7.6
Forced air cooling is commenced after each pre-
cycle to cool the coupons to ambient temperature.
5.2.7.7
The system automatically records and saves all
information regarding the pre-cycling conditions for subse-
quent stress testing.
5.2.8 Stress Cycle Test Sequence
The following para-
graphs detail the sequence for a single coupon; however this
sequence is done at all test heads simultaneously.
5.2.8.1
When the pre-cycle sequence is complete, the
Method A stress test is initiated by applying the same DC cur-
rent level established for each individual coupon during the
pre-cycle operation for three minutes. The computer monitors
and records the relative changes in resistance of the plated
barrel and internal connections throughout the heating cycle.
5.2.8.2
The three minutes of heating is followed by forced
air cooling. Cooling time is a function of overall thickness and
construction of the coupon. The computer monitors and
records the coupon’s performance throughout the cooling
cycle.
5.2.8.3
The individual coupons are placed on the tester and
are continually thermal cycled using their customized heating
and cooling conditions until the rejection criteria is achieved or
the maximum number of cycles is completed.
5.2.8.4
The coupon’s resistance ‘‘delta’’ (the variance from
resistance of coupon at test temperature for Cycle 2)
increases (positively) as failure inception occurs. The rate of
change in the delta is indicative of the mechanical change
(failure) within the barrel and/or internal connections.
Number
2.6.26
Subject
DC Current Induced Thermal Cycling Test
Date
5/14
Revision
A
IPC-TM-650
NOTE:
NOTE:
Page
5
of
10
5.2.8.5
When an individual coupon delta reaches the rejec-
tion resistance, Method A stress cycle testing is stopped for
the coupon. The rejection criteria provides for early interven-
tion so failure analysis activities can try to find the root cause
for the failure with minimal collateral damage from the stress
cycle.
5.2.8.6
The heating and cooling resistance data is compiled
for each coupon’s performance throughout the stress testing.
The system software provides a download file to graph the
coupon’s performance. Data is compiled to create graphs of
each coupon’s performance throughout stress testing.
5.2.8.7
The data is tabulated into a test report for analysis.
5.2.8.7.1 Tabulation of Results for Single Sense
Testing
The test data should be organized to provide the
following:
• Test Coupon Description
• Test Parameters
• Sample ID
• Power Circuit (P) Cycles to Failure or End of Test
• Power Circuit Percent Change
• Sense Circuit (S) Cycles to Failure or End of Test
• Sense Circuit Percent Change
• Disposition of Test Results
5.2.8.7.2 Tabulation of Results for Dual Sense Testing
The test data should be organized to provide the same data
as described in 5.2.8.7.1 with the addition of the following:
• Sense Circuit (S1,S2) Cycles to Failure or End of Test
• Sense Circuit (S1,S2) Percent Change
5.2.8.8
The resistance data for the coupons are plotted on
resistance graphs to indicate how damage is accumulated
over the test cycles.
5.2.8.9 Microsection (Optional)
An appropriate number
of coupons are selected for microsection review. A small cur-
rent is placed on the failing circuit and observed under a ther-
mal camera (see 6.2 and Figure 6-1). The most damaged
interconnection is selected for microscopic review.
5.2.8.10
Review all the tabulated data for a determination of
the disposition of the coupons.
5.3 Method B Procedure
5.3.1
Unless otherwise specified by the user, the default test
condition be Tin/Lead Reflow in accordance with Table
5-2.
5.3.2 Assembly Precondition (Optional)
See Table 5-2
Note 1. See also 6.1.
5.3.3 Temperature Coefficient of Resistance Test
Sequence
The TCR is calculated once for each unique cou-
pon type or cell. Once determined, that TCR is used for
Method B testing of all coupons of that type or cell. Examples
of elements that can affect the TCR and therefore define a
coupon type/cell are: via structure (thru holes vs. buried vias
vs. microvias, etc.), via diameter, via length, total board thick-
ness, laminate/resin material, plating chemistry, type of via fill,
and surface finish.
5.3.3.1 Temperature Coefficient of Resistance
Deter-
mine the TCR of each unique coupon type or cell using the
average value from 2 to 4 coupon samples. Attach coupons
to each quick connect test fixture and close the oven door. A
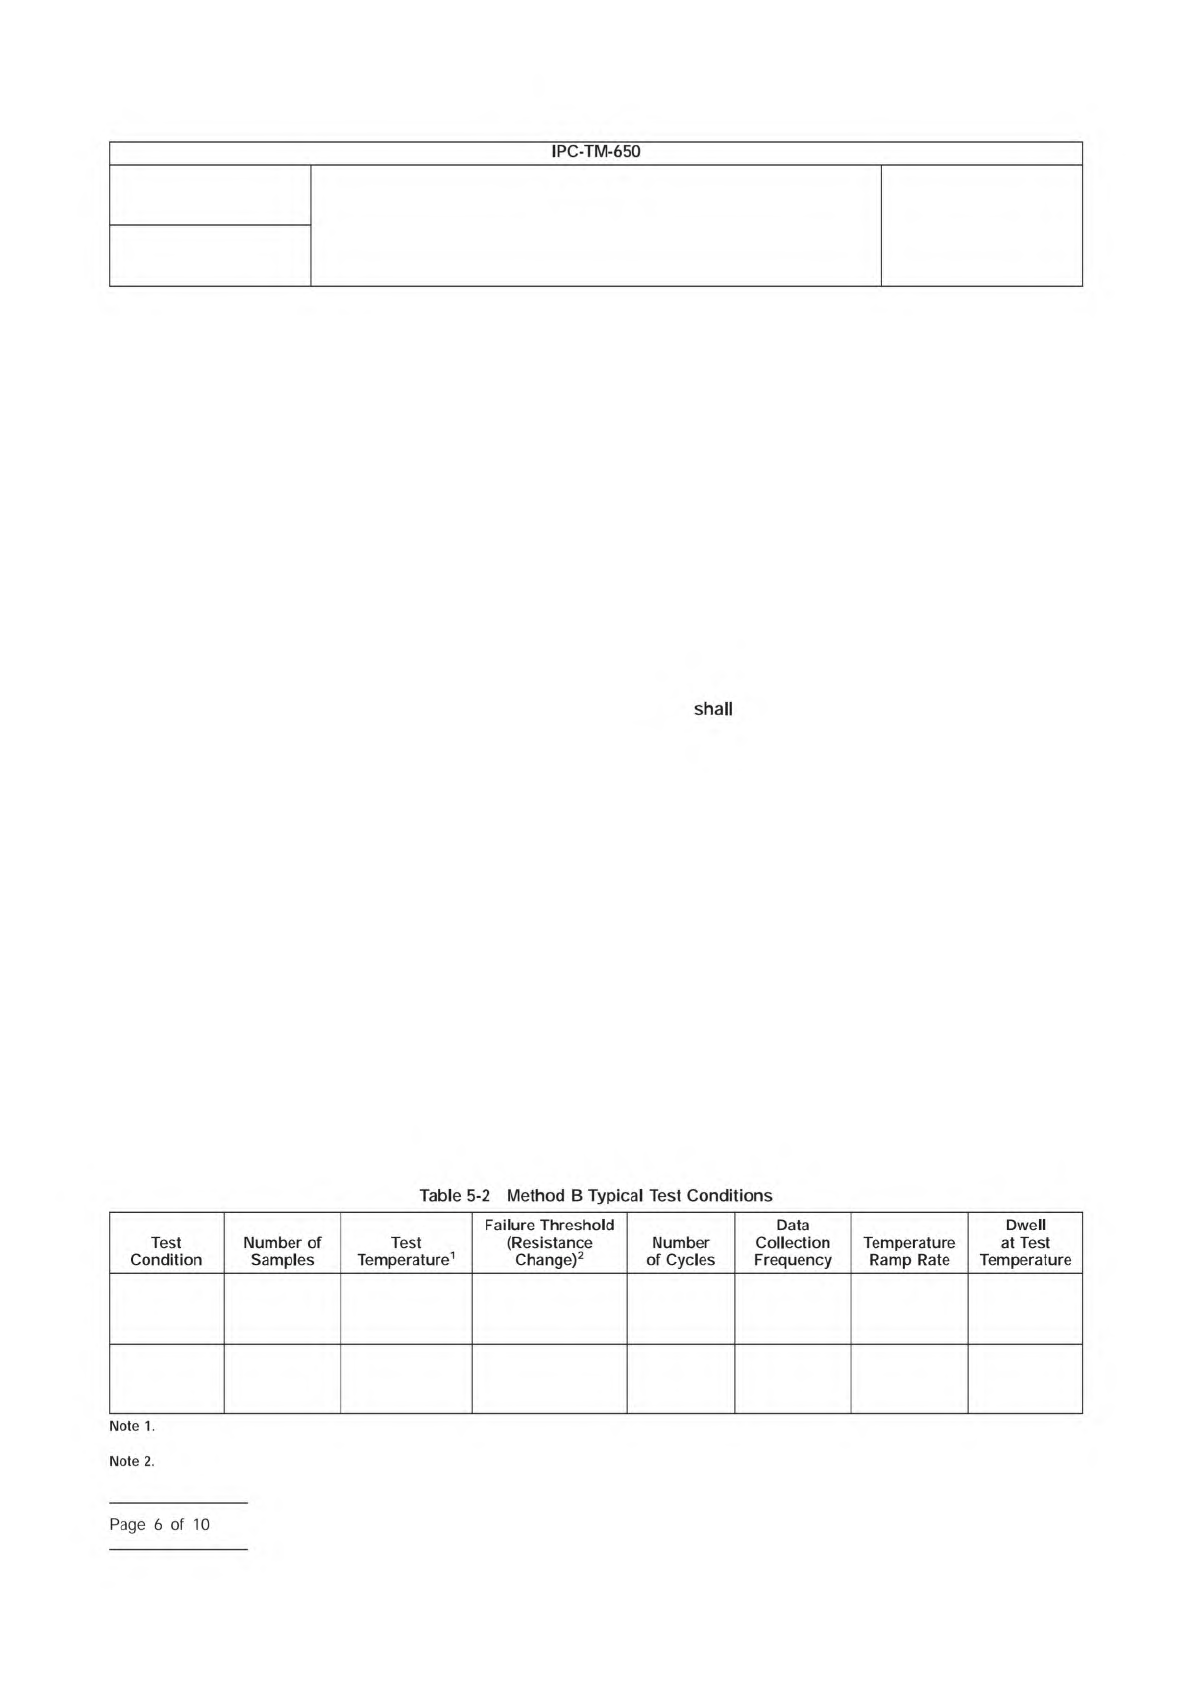
Tin/Lead
Reflow
(Default)
8
23 to 220 °C
[73 to 428 °F]
5% per cycle or
10% from first
cycle
10
1 second
intervals
3°C / second 40 seconds
Lead-Free
Reflow
8
23 to 245 °C
[73 to 473 °F]
5% per cycle or
10% from first
cycle
10
1 second
intervals
3°C / second 40 seconds
These default test conditions represents assembly conditions, and therefore assembly preconditioning is not required. The available temperature test range
is from 23 to 300 °C [73 to 572 °F] to any number of cycles.
See 5.3.5.
Number
2.6.26
Subject
DC Current Induced Thermal Cycling Test
Date
5/14
Revision
A
IPC-TM-650
shall
Table
5-2
Method
B
Typical
Test
Conditions
Note
1.
Test
Condition
Number
of
Samples
Test
Temperature1
Failure
Threshold
(Resistance
Change)2
Number
of
Cycles
Data
Collection
Frequency
Temperature
Ramp
Rate
Dwell
at
Test
Temperature
Note
2.
Page
6
of
10

computer controls the oven temperature through a range of
temperatures from 23 °C to 260 °C [73 to 500 °F]. The com-
puter monitors and records the equilibrium resistance for each
temperature. The equation used to calculate the TCR for each
tested coupon is as follows:
TCR(T) =
(Rh − Rrm)
(Th − Trm) x Rrm
where:
TCR(T) = Calculated TCR for the coupon as a function of
intended Method B Test Temperature T
Th = Temperature of coupon at oven temperature
Rh = Resistance of coupon at oven temperature
Rrm = Resistance of coupon at ambient temperature
Trm = Ambient Temperature (approximately 23 °C [73 °F])
5.3.4 Stress Cycle Definition
The system calculates and
displays the coupon test temperature with the following equa-
tion:
T = Trm +
(R − Rrm)
(Rrm x TCR(T))
where:
TCR(T) = Measured thermal coefficient of resistance for this
type/cell of coupons (see 5.3.3.1)
Rrm = Resistance of coupon at ambient temperature
measured at start of each cycle
T = Coupon test temperature calculated at 1 second
intervals
R = Coupon resistance measured at 1 second intervals
Trm = Ambient temperature measured at each cycle
(approximately 23 °C [73 °F])
Alternately, this equation may be expressed in terms of the
target resistance that is equivalent to the targeted high tem-
perature for that coupon and cycle, as follows:
Target Resistance = Rrm x (1 + TCR(Th)[Th - Trm])
where:
Th = Target high test temperature
5.3.5 Failure Threshold
Three different failure criteria or a
combination of these three may be used for a Method B cycle
as shown below. Refer to definitions for the variable names
and the equation for Target Resistance in 5.3.3.
1) R-high. During any single cycle, R exceeds target value by
more than R1% (default R1 = 5%) anytime during cycle,
that is,
R-high failure threshold: R > Target Resistance x (1 + R1).
2) R-low. During any single cycle, the final Rrm(n) after cool-
ing is greater than Rrm(n-1) of the previous cycle by more
than R2% (default R2 = 5%), that is
R-low failure threshold: Rrm(n) Rrm(n-1) x (1 + R2).
3) R-delta. Coupon is failed at cycle n if the final Rrm(n) after
cooling is equal to or greater than R3% (default R3=10%)
change from Rrm(0) at the start of test prior to cycle 1.
R-delta Failure Threshold: Rrm(n) > Rrm(0) x (1 + R3).
5.3.6 Stress Cycle Test Sequence
The following para-
graphs detail the sequence for a single coupon; however this
sequence is done at all test heads simultaneously.
5.3.6.1
Stress test coupons are placed in the table top test
fixture. The test fixture includes a cooling fan and quick con-
nect housings for the test coupons.
5.3.6.2
The Method B test system uses the TCR and asso-
ciated equation (see 5.3.3) to heat the coupon with DC cur-
rent (variable level determined in 1 second intervals) to the
prescribed ramp rate and high test temperature. The com-
puter also monitors and records the relative changes in resis-
tance of the plated barrel throughout the heating cycle.
5.3.6.3
The dwell time at test temperature is followed by
forced air cooling. Cooling time is a function of overall thick-
ness and construction of the coupon. The computer monitors
and records the coupon’s performance throughout the cool-
ing cycle.
5.3.6.4
The individual coupons are continually thermal
cycled using their customized heating and cooling conditions
until one of the rejection criteria is achieved or the maximum
number of cycles is completed.
5.3.6.5
The heating and cooling resistance data is compiled
for each coupon’s performance throughout the stress testing.
The system software provides a download file to graph the
coupon’s performance. Data is compiled to create graphs of
each coupon’s performance throughout stress testing.
5.3.7 Graphing and Data Analysis
5.3.7.1 Tabulation of Results
Test results are typically
reported with the following information:
• Test Coupon Description
• Test Parameters: Temperature(s), ramp rate, dwell
Number
2.6.26
Subject
DC Current Induced Thermal Cycling Test
Date
5/14
Revision
A
IPC-TM-650
Page
7
of
10