IPC-TM-650 EN 2022 试验方法--.pdf - 第278页
Note: IPC-TM-650 Page 3 of 3 Number 2.4.14.2 Subject Liquid Flux Activity, Wetting Balance Method Date 06/04 Revision A addition, the method can help evaluate fluxing power on criti¬ cal applications prior to manufacturi…
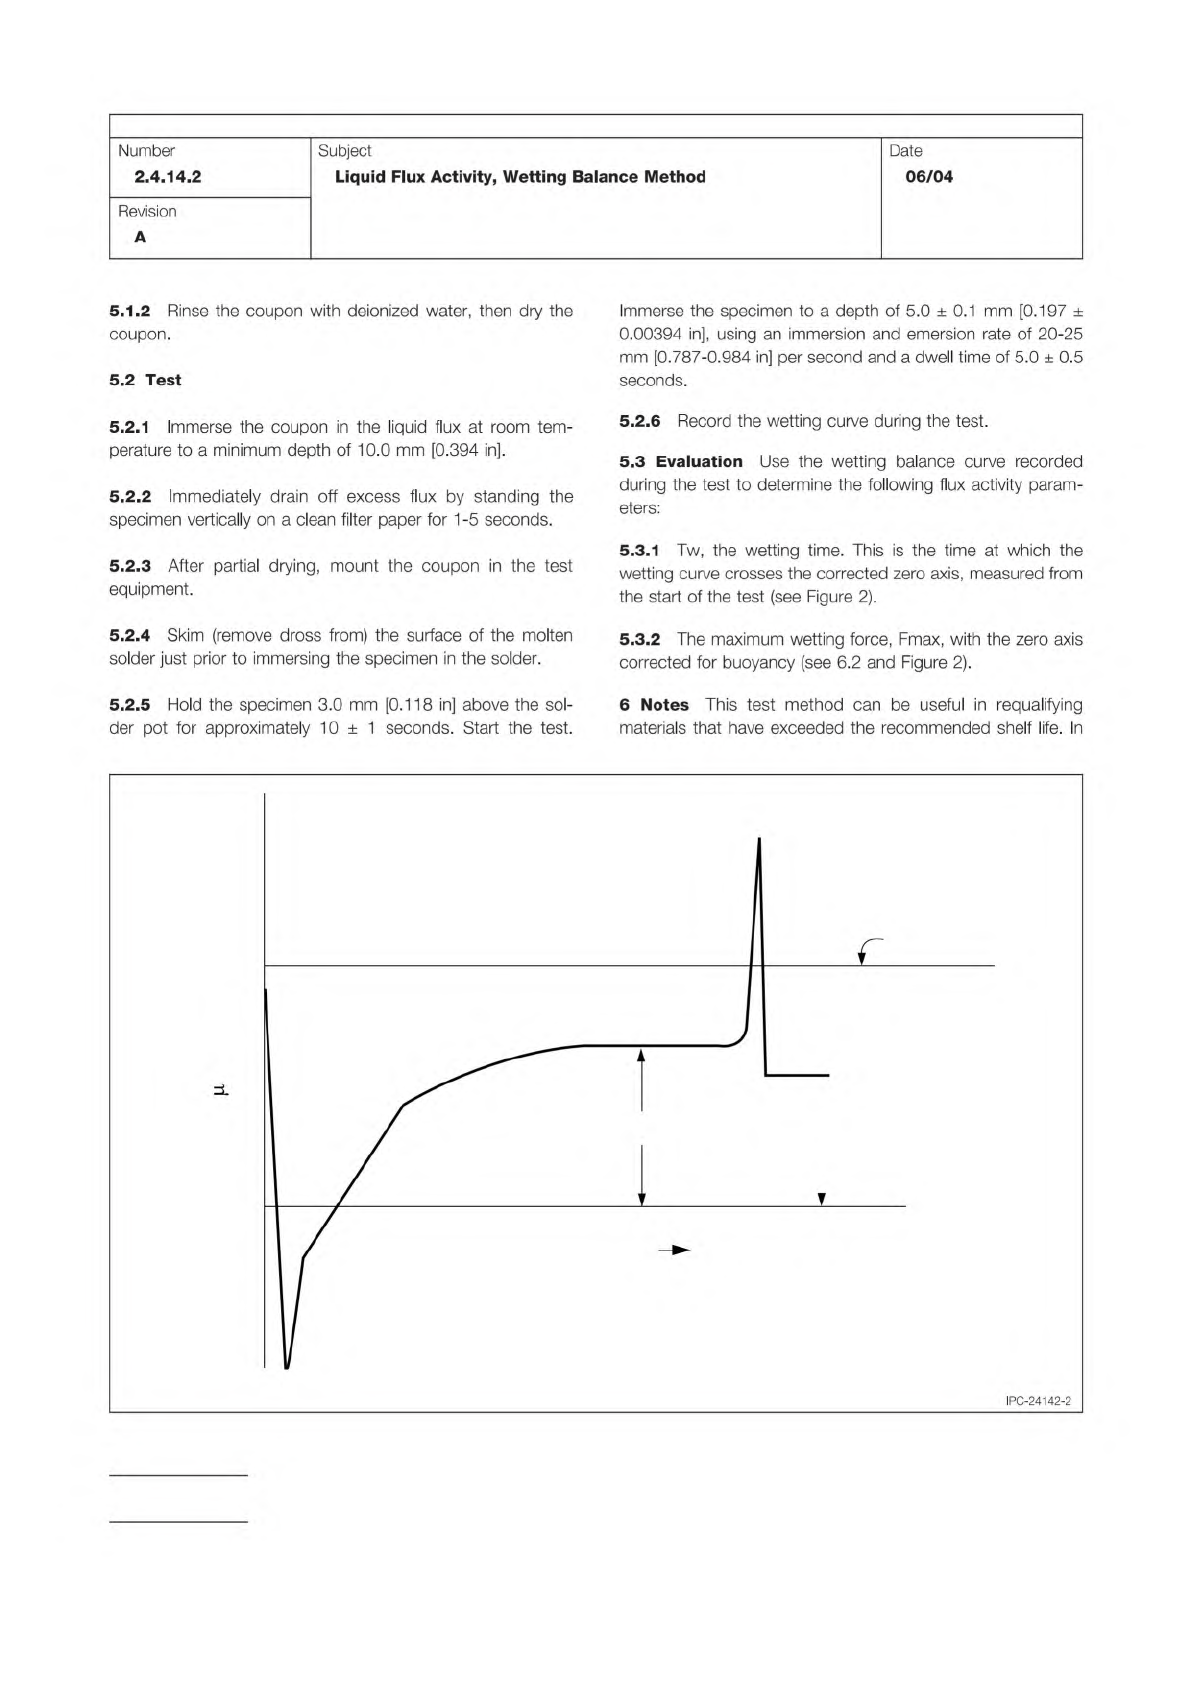
Figure 2 Wetting Balance Curve
TIME
FORCE ( N)
0
Instrument Zero
Corrected Zero
Fmax
T
w
IPC-TM-650
Page 2 of 3
Number
2.4.14.2
Revision
A
Subject
Liquid
Flux
Activity,
Wetting
Balance
Method
Date
06/04
5.1.2
Rinse
the
coupon
with
deionized
water,
then
dry
the
coupon.
5.2
Test
5.2.1
Immerse
the
coupon
in
the
liquid
flux
at
room
tem¬
perature
to
a
minimum
depth
of
10.0
mm
[0.394
in].
5.2.2
Immediately
drain
off
excess
flux
by
standing
the
specimen
vertically
on
a
clean
filter
paper
for
1
-5
seconds.
5.2.3
After
partial
drying,
mount
the
coupon
in
the
test
equipment.
5.2.4
Skim
(remove
dross
from)
the
surface
of
the
molten
solder
just
prior
to
immersing
the
specimen
in
the
solder.
5.2.5
Hold
the
specimen
3.0
mm
[0.1
18
in]
above
the
sol¬
der
pot
for
approximately
10
±
1
seconds.
Start
the
test.
Immerse
the
specimen
to
a
depth
of
5.0
土
0.1
mm
[0.197
±
0.00394
in],
using
an
immersion
and
emersion
rate
of
20-25
mm
[0.787-0.984
in]
per
second
and
a
dwell
time
of
5.0
土
0.5
seconds.
5.2.6
Record
the
wetting
curve
during
the
test.
5.3
Evaluation
Use
the
wetting
balance
curve
recorded
during
the
test
to
determine
the
following
flux
activity
param¬
eters:
5.3.1
Tw,
the
wetting
time.
This
is
the
time
at
which
the
wetting
curve
crosses
the
corrected
zero
axis,
measured
from
the
start
of
the
test
(see
Figure
2).
5.3.2
The
maximum
wetting
force,
Fmax,
with
the
zero
axis
corrected
for
buoyancy
(see
6.2
and
Figure
2).
6
Notes
This
test
method
can
be
useful
in
requalifying
materials
that
have
exceeded
the
recommended
shelf
life.
In
IPC-24142-2
Note:
IPC-TM-650
Page 3 of 3
Number
2.4.14.2
Subject
Liquid
Flux
Activity,
Wetting
Balance
Method
Date
06/04
Revision
A
addition,
the
method
can
help
evaluate
fluxing
power
on
criti¬
cal
applications
prior
to
manufacturing
operations.
6.1
Safety
Observe
all
appropriate
precautions
on
MSDS
for
chemicals
involved
in
this
test
method.
6.2
Correction
for
Buoyancy
For
the
results
from
different
wetting
balance
tests
to
be
relatable,
it
is
necessary
to
correct
for
the
variability
in
specimen
sizes.
This
is
done
by
correcting
the
zero
axis
for
the
buoyant
force
produced
by
the
volume
of
sample
immersed
in
the
solder.
(The
instrument
zero
corrects
for
the
weight
of
the
specimen.)
The
following
formula
is
used
to
calculate
the
magnitude
of
the
buoyant
force
correction,
Pb>
h
pN:
Pb
=
p
gV
Where:
p
=
Density
of
solder
@
245℃
(8.1
5g/cm3)*
g
=
Acceleration
of
gravity
(9810
mm/s2
[386.220
in/2])
V
=
Immersed
volume
of
coupon
(cm3)
v
=
width
x
thickness
x
immersion
depth)
*For
Sn60/Pb40
Alloy
The
calculated
buoyancy
force
must
be
used
to
correct
the
zero
axis.
This
correction
is
required
to
obtain
correct
values
of
wetting
times
as
well
as
wetting
forces.
All
measurements
of
wetting
times
and
wetting
forces
must
be
made
from
the
corrected
zero
axis.
In
the
case
of
an
upright
(tensile
force)
curve,
the
corrected
zero
axis
will
be
below
the
instrument
zero,
as shown
in
Figure
2.
The
vertical
(tensile)
force
measured
by
the
wetting
bal¬
ance
consists
of
three
forces
-
the
weight
of
the
specimen,
the
buoyancy
force,
and
the
wetting
force
caused
by
the
sur¬
face
tension
of
the
solder
and
its
interaction
with
the
fluxed
coupon.
The
weight
of
the
specimen
is
constant,
and
is
included
in
the
instrument
zero
axis.
The
buoyancy
force
is
equal
to
the
weight
of
the
solder
dis¬
placed
when
the
specimen
is
immersed.
It
changes
as
the
specimen
is
lowered
into
and
removed
from
the
solder,
but
may
be
considered
constant
during
the
dwell
time.
The
only
changing
force
during
the
dwell
time
is
the
wetting
force.
Changes
in
this
force
are
caused
by
the
contact
angle
changing
from
initial
nonwetting
to
wetting,
as
the
specimen
solders.
The
corrected
zero
(buoyancy)
line
is
the
force
when
the
contact
angle
is
90°,
or
when
the
bath
surface
has
returned
to
horizontal,
having
been
initially
depressed
by
the
immersed
sample.
When
the
contact
angle
is
90°,
the
contri¬
bution
of
the
wetting
force
to
the
total
vertical
force
is
0.
The
wetting
balance
curve
is
centered
on
the
corrected
zero
(buoyancy)
line,
since
the
only
parameter
that
changes
during
the
test
dwell
time
is
the
contact
angle,
0.
The
measured
ver¬
tical
tensile
force,
F,
in
pN
(omitting
the
constant
weight
of
the
specimen,
which
is
zeroed
out
by
the
instrument),
is
given
by:
F
=
y
p
cos
0
-
g
pv
Where:
y
=
Surface
tension
of
molten
solder
(400
pN/mm)
p
二
Specimen
perimeter
in
mm
9
=
Contact
angle
g
=
Gravitational
acceleration
(9.81
x
103
mm/s2)
p
=
Solder
density
(-8000
pg/mm3)
v
=
Immersed
volume
in
mm3
The
buoyancy
is
the
value
of
F
when
9
is
90°
(cos
0
二
0):
Buoyancy
=
-gpv
The
corrected
zero
line
(buoyancy)
is
the
fixed
reference
point
for
wetting
force
and
wetting
time
measurements.
Altering
the
specimen
dimensions
changes
the
immersed
vol¬
ume
and
hence
the
buoyancy,
and
so
alters
the
position
of
the
corrected
zero
line;
but
the
wetting
curve
still
remains
centered
on
this
line.
Similarly,
any
change
in
immersion
depth
will
also
alter
the
immersed
volume,
with
the
same
effect
on
the
buoyancy.
Although
use
of
the
corrected
zero
line
will
cancel
small
varia¬
tions
in
the
specimen
immersed
volume
and
the
immersion
depth,
large
changes
will
affect
the
rate
of
heat
transfer
into
the
specimen,
which
will
affect
both
Tw,
the
time
to
recross
the
corrected
zero
(buoyancy)
line,
and
the
time
to
reach
Fmax.
Note:
Note:
The Institute for Interconnecting and Packaging Electronic Circuits
2215 Sanders Road • Northbrook, IL 60062-6135
Material in this Test Methods Manual was voluntarily established by Technical Committees of the IPC. This material is advisory only
and its use or adaptation is entirely voluntary. IPC disclaims all liability of any kind as to the use, application, or adaptation of this
material. Users are also wholly responsible for protecting themselves against all claims or liabilities for patent infringement.
Equipment referenced is for the convenience of the user and does not imply endorsement by the IPC.
Page 1 of 1
IPC-TM-650
TEST
METHODS
MANUAL
1
.0
Scope
A
test
method
for
measuring
the
geometric
irregularities
(roughness,
waviness,
etc.)
of
the
surface
of
metal
foils.
2
.0
Applicable
Documents
None
3
.0
Test
Specimen
Any
sample
of
metal
foil
to
be
tested.
Care
must
be
taken
to
insure
that
there
are
no
wrinkles
or
kinks
in
the
sample.
4
.0
Apparatus
4.1
Amplimeter,
with
range
selector
for
measuring
surface
roughness
in
micro
inches.
4.2
Pilotor
(electric)
used
to
operate
the
tracer.
4.3
Tracer,
for
tracing
and
detecting
surface
irregularities.
4.4
Controlled
Roughness
Specimen
4.5
Surface
Plate
5
.0
Procedure
5.1
Test
5.1.1
Place
the
amplimeter
on
a
rigid
support
such
as
a
work
bench,
stand,
or
machine
table
with
space
beside
it
for
the
pilotor
that
will
be
used.
Do
not
connect
the
amplimeter
to
a
power
line
supply¬
ing
heavy
induction
equipment
such
as
induction
furnaces,
welders
and
induction
motors.
The
starting
and
stopping
of
such
equipment
will
cause
fluctuations
in
the
AC
line
voltage
which
may
result
in
erroneous
roughness
readings.
5.1.2
Set
the
AA/RMS
selector
switch
at
AA
(for
arithmetical
average),
and
turn
on
amplimeter.
Number
2.4.15
Subject
Surface
Finish,
Metal
Foil
Date
Revision
3/76
A
Originating
Task
Group
N/A
1.
Position
the
tracer
with
an
appropriate
skidmount
in
place
on
the
work
surface.
Do
not
try
to
use
the
tracer
without
a
skidmount.
2.
With
the
tracer
stationary
and
the
pilotor
cable
discon¬
nected
read
the
amplimeter
digital
display.
If
the
reading
is
higher
than
the
work
allows,
move
the
setup
to
a
steadier
support
and
repeat
the
check.
3.
The
displayed
reading
should
not
be
greater
than
1
0%
of
the
roughness
to
be
measured.
5.1.4
Set
the
roughness-width
cutoff
at
0.030
inch.
5.1.5
Set
the
“Range”
selector
switch.
5.1.6
Set
the
pilotor
stroke
length
between
1
in.
and
1
.5
in.
5.1.7
To
make
sure
that
the
equipment
in
paragraph
4.0
is
operating
properly,
take
a
reading
of
the
rated
roughness
specimen.
The
controlled
roughness
specimen
must
be
thoroughly
cleaned
before
it
is
used.
A
dirty
specimen
will
give
erroneous
readings.
5.1.8
If
erroneous
display
readings
are
obtained,
check
the
following
conditions:
1.
Amplimeter
is
turned
on.
2.
Tracer
is
connected
to
the
amplimeter
with
all
connections
tight.
3.
Tracer
is
moving
over
the
work.
4.
Tracer
point
is
in
contact
with
the
work.
5.
Check
the
tracer
cable
for
wear
and
for
open
or
short
cir¬
cuits.
6.
Check
for
a
blown
fuse
in
the
amplimeter.
5.2
Evaluation
Record
roughness
readings
in
micro
inches
using
Arithmetical
Average
(AA).
A
minimum
of
3
areas
per
sample
should
be
taken
for
determining
the
surface
rough¬
5.1.3
Check
setup
for
minimum
vibration.
ness.